Micro-Crack Healing on Soda-Lime Glass by Chemical Strengthening
Article information
Abstract
We studied whether chemical strengthening can heal the flaws on soda-lime silicate glass. Artificial surface cracks were introduced on the glass by sharp indentation with various loads of 0.1 to 10 N. Then, the glasses with flaws were treated by ion-exchanging in KNO3 melt. The change in the dimension of the crack on glass was measured by a digital microscope and a scanning electron microscope. The chemical strengthening treatment enhances the strength of the glass with flaws. It is thought that the melted KNO3 not only forms the depth of the compressed layer of 7.5 μm, but also heals the cracks by infiltrating them and expanding the glass on both sides of the cracks. The critical length (2c) of the cracks on soda-lime glass that can be healed by chemical strengthening is 50 μm or less.
1. Introduction
Chemical strengthening technology for cover glass to protect the touch panels of mobile devices such as smart phones and tablet PCs has been attracting attention. This technology was first introduced in 1962 by Kistler,1) and Varshneya made a remarkable contribution in terms of not only the technology but also commercial development.2) This technology can improve the mechanical properties such as the strength and hardness of glass by generating a compressive stress on the glass surface through replacement of the sodium in glass with potassium, which exhibits a larger ionic radius.3) Currently, the most widely used chemical tempering glass is Gorilla Glass®, manufactured by Corning Co., which is based on Na2O-Al2O3-SiO2 system4) and is a cousin of the glass with non-alkali alumino-silicate glass for LCD application. Soda-lime glass, usually called plate glass, also contains a large amount of sodium, therefore, it can be chemically strengthened. Soda-lime glass displays a different internal structure than Gorilla Glass, therefore, it is difficult to diffuse the chemical strengthening component (K+) into the glass, which results in a lower strengthening depth and easier scratch formation, compared to alumino-silicate glass.5)
It is known that chemical strengthening technology not only strengthens the glass surface but also heals the surface micro-cracks. Macrelli summarized the relationship between the surface crack depth, strength, and toughness before and after strengthening and postulated that when the crack depth becomes larger than the strengthening depth during service after the chemical strengthening, locally, the effect of chemical strengthening is lost and the glass behaves as if it is not strengthened.6) The results of the change in strength upon damage after the chemical toughening treatment are disclosed in Glass Handbook for the various glass types.7) However, it was hard to find literature on practical research on cracks of what size can be healed on a glass surface by chemical strengthening. Therefore, in this study, we investigated 1) the influence of the size of the crack that existed before strengthening on the strength of a glass after strengthening and 2) the critical crack size that can be healed by chemical strengthening.
2. Experimental Procedure
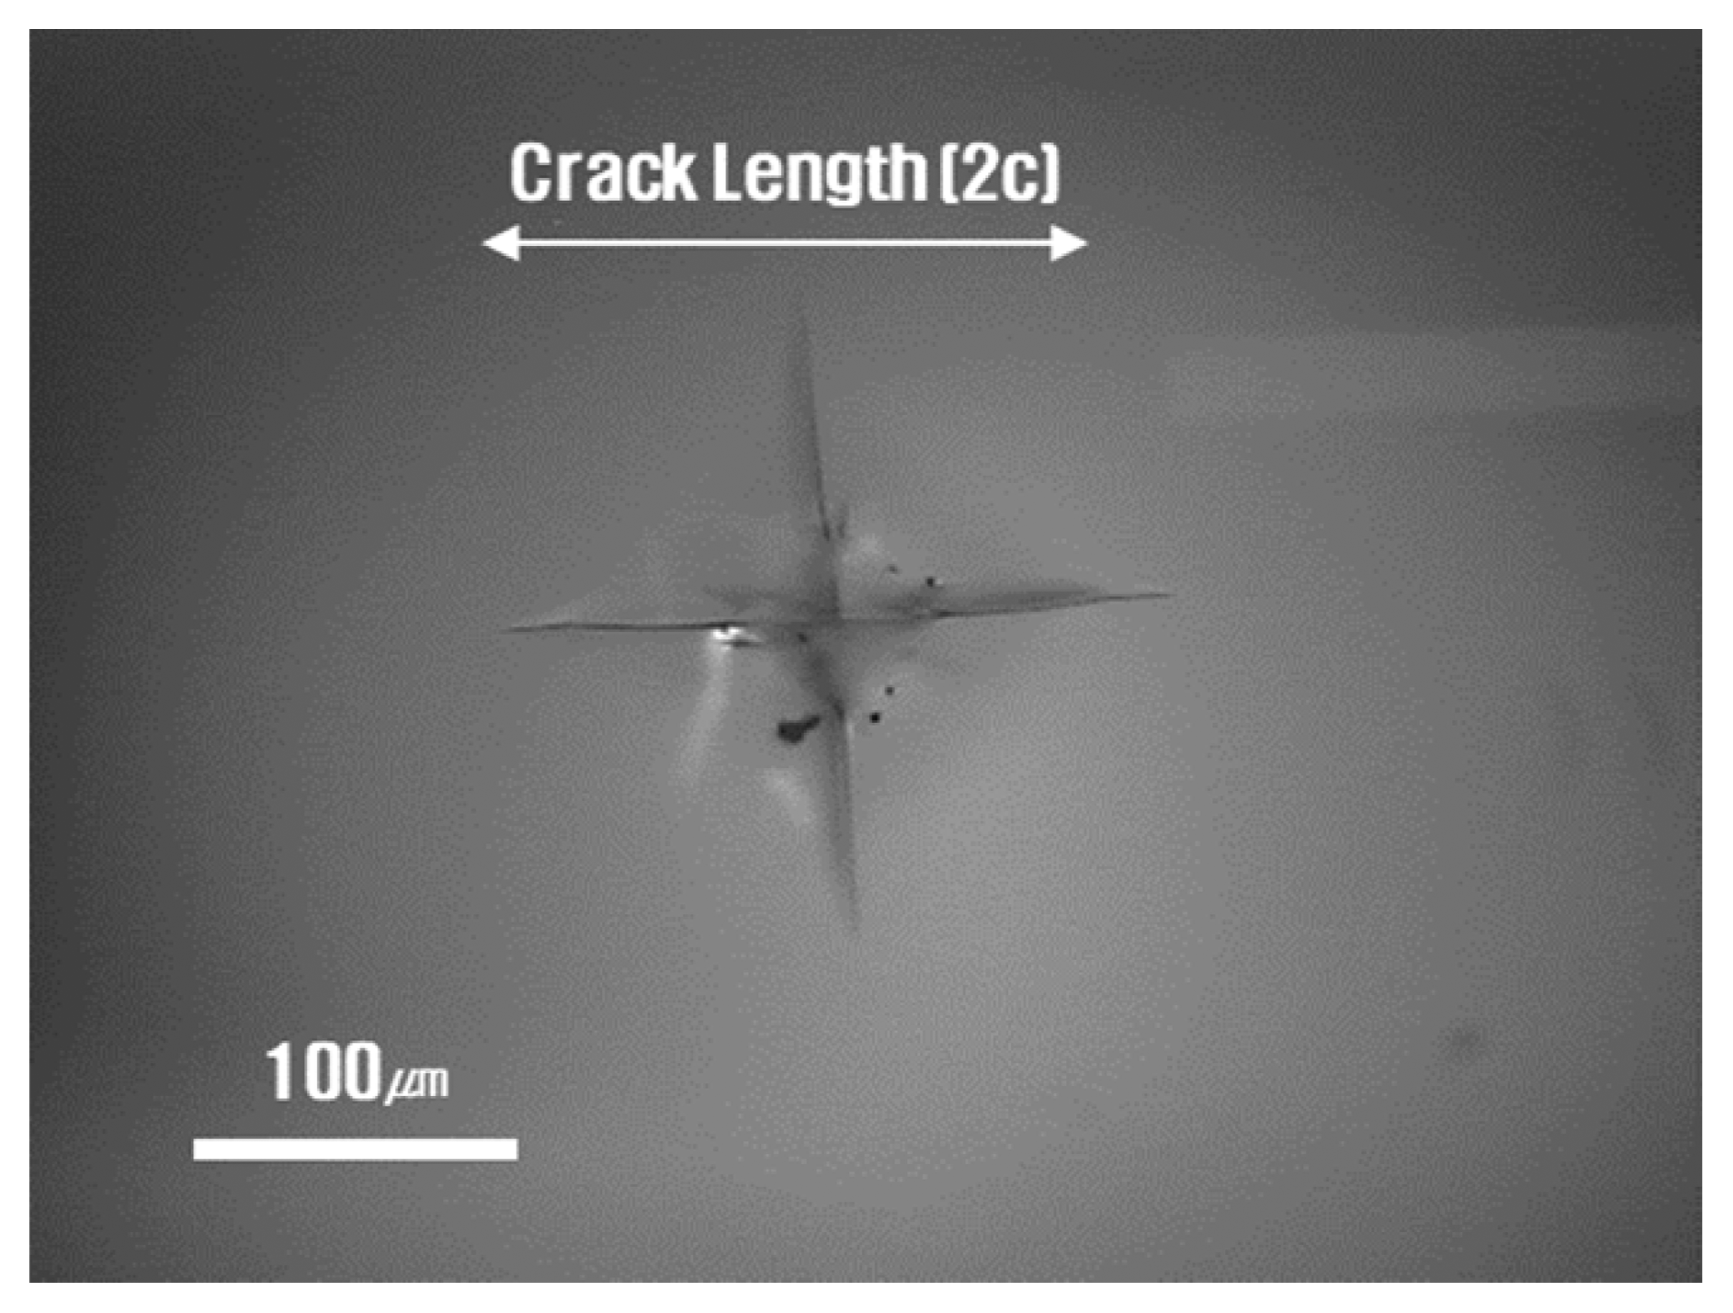
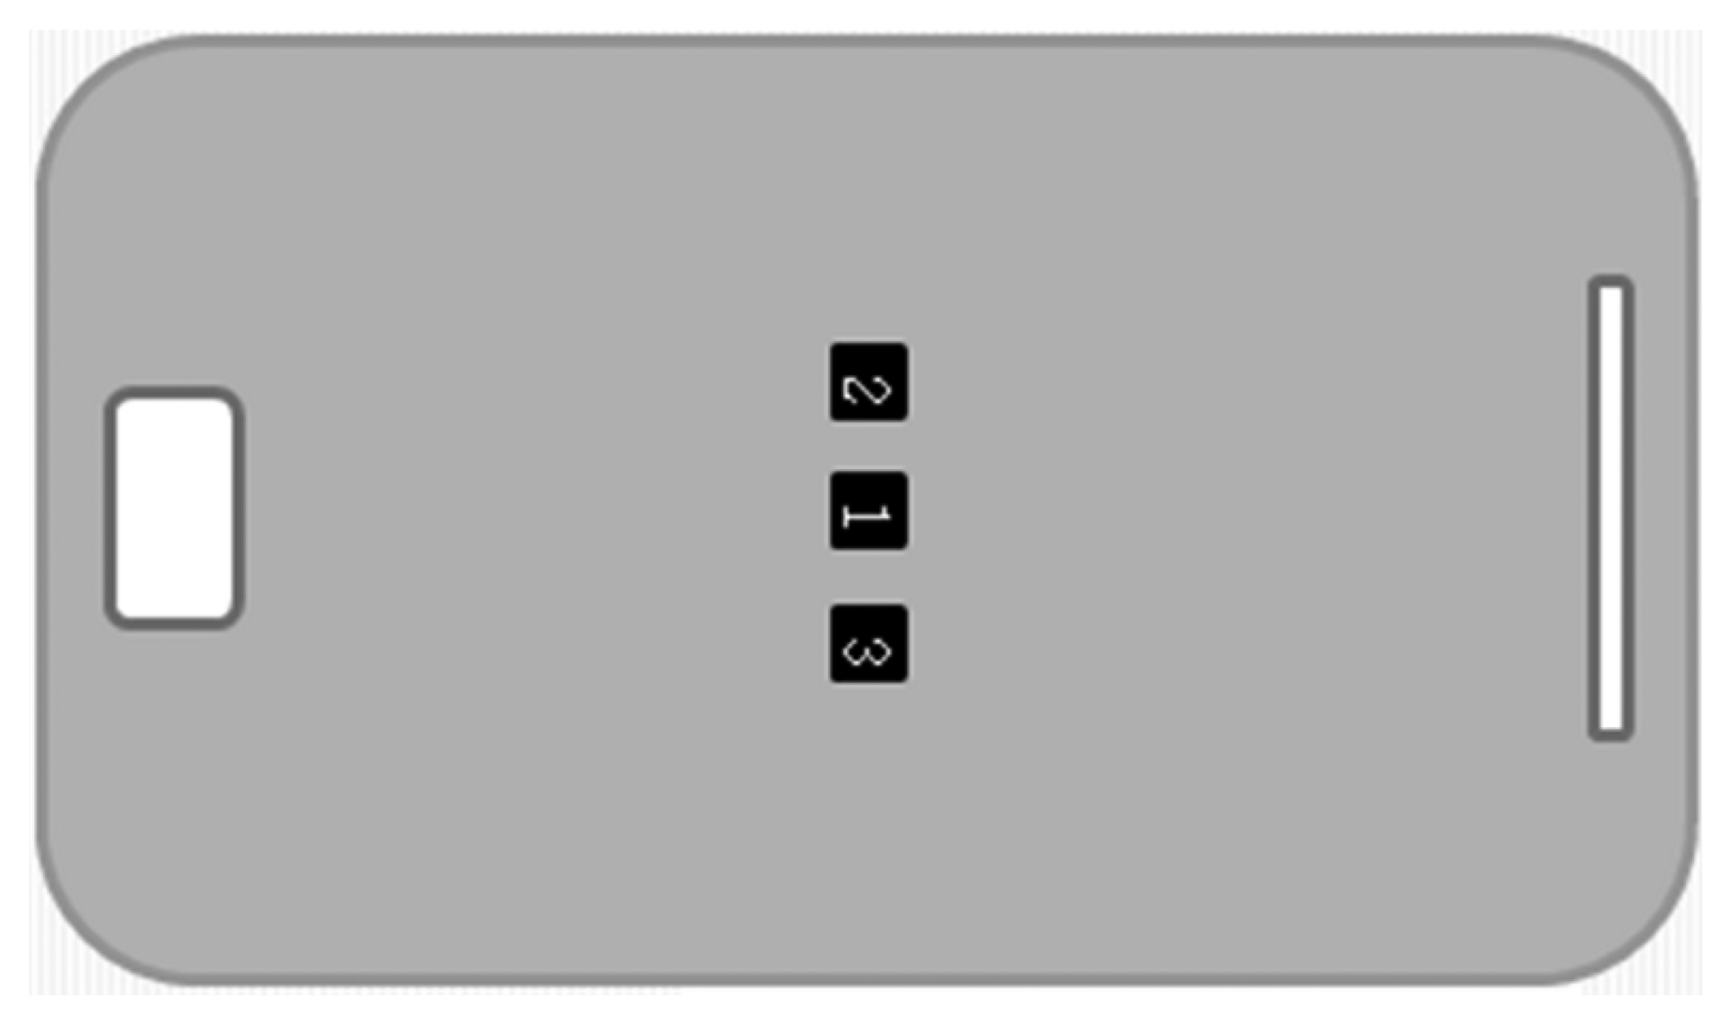
The glass used in this study was soda-lime glass, manufactured by Asahi Glass Co. Ltd. for mobile phones, with the size of 50 × 100 × 0.7 mm3. A Vickers hardness tester (Shimadzu, HMV 2T, Japan) was used to generate the cracks on the soda-lime glass surface before strengthening. Fig. 1 shows a crack generated on the glass surface that was observed with the microscope of the Vickers hardness tester when the sample was pressed at 10 N with the help of the Vickers indenter. As shown in Fig. 2, cracks were formed at three locations at 10 mm intervals from the center of the glass with the forces of 0.1, 0.25, 0.5, 1, 2, 3, 5, and 10 N that correspond to different Vickers indentation pressures. Five samples were prepared for each condition.
The strength was evaluated before and after the chemical strengthening of the cracked glass substrate by biaxial strength method, based on ASTM C1499-09. The reason for the strength evaluation by the biaxial method is that it is a measurement technique that can eliminate the influence of the corner portions. The biaxial strength was measured by using a universal testing machine (R&B, 302ML, Korea).
The chemical strengthening treatment was carried out in a KNO3 molten bath at 400°C for 6 h, according to the results of previous research.8) The glass holding jig was rotated in the molten bath to avoid deviations in the strengthening of the glass specimen. The mean strengthened depth and compressive stress were 7.5 μm and 670 MPa, respectively, which were measured using surface stress analysis equipment (FMS-6000, Japan). The cross-sections of the glasses were observed using a scanning electron microscope (JEOL, JSM-6390, Japan) that was equipped with an energy dispersive spectroscope (EDS; Oxford Instruments, Aztec, UK).
3. Results and Discussion
Figure 3 shows the length (2c) of the crack generated on the glass surface that depends on the indentation load. As the indentation load increases, the crack length on the glass surface increases. Cracks about 200 μm in length were generated at the indentation load of 10 N. These results are in good agreement with the results previously reported in the literature.9–11)
Figure 4 is the result of measuring the biaxial strength of the glass containing cracks before and after the chemical strengthening. The initial strength of the glass before the strengthening was about 500 MPa, and it tended to decrease with the increase in the indentation load. After the chemical strengthening, the biaxial strength was about 2 GPa, which was more than four times higher than that before the strengthening. It was confirmed that even when the indentation load increased to 1 N, that is, even if a crack of a predetermined size was included, the strength was not affected. However, when an indentation load of 2 N or more was applied, the strength started to deteriorate, and rapidly decreased at 3 N or more. Comparing Fig. 3 and Fig. 4, it can be seen that the length of the crack had little effect on the strength after the chemical strengthening until the length (2c) of the crack generated by the indentation load reached about 50 μm. When the length of the crack exceeded 50 μm, the strength of the chemically tempered glass was higher than that of the untreated glass, however, the strength decreased rapidly with the increase in the indentation load, that is, with the increase in the crack size.
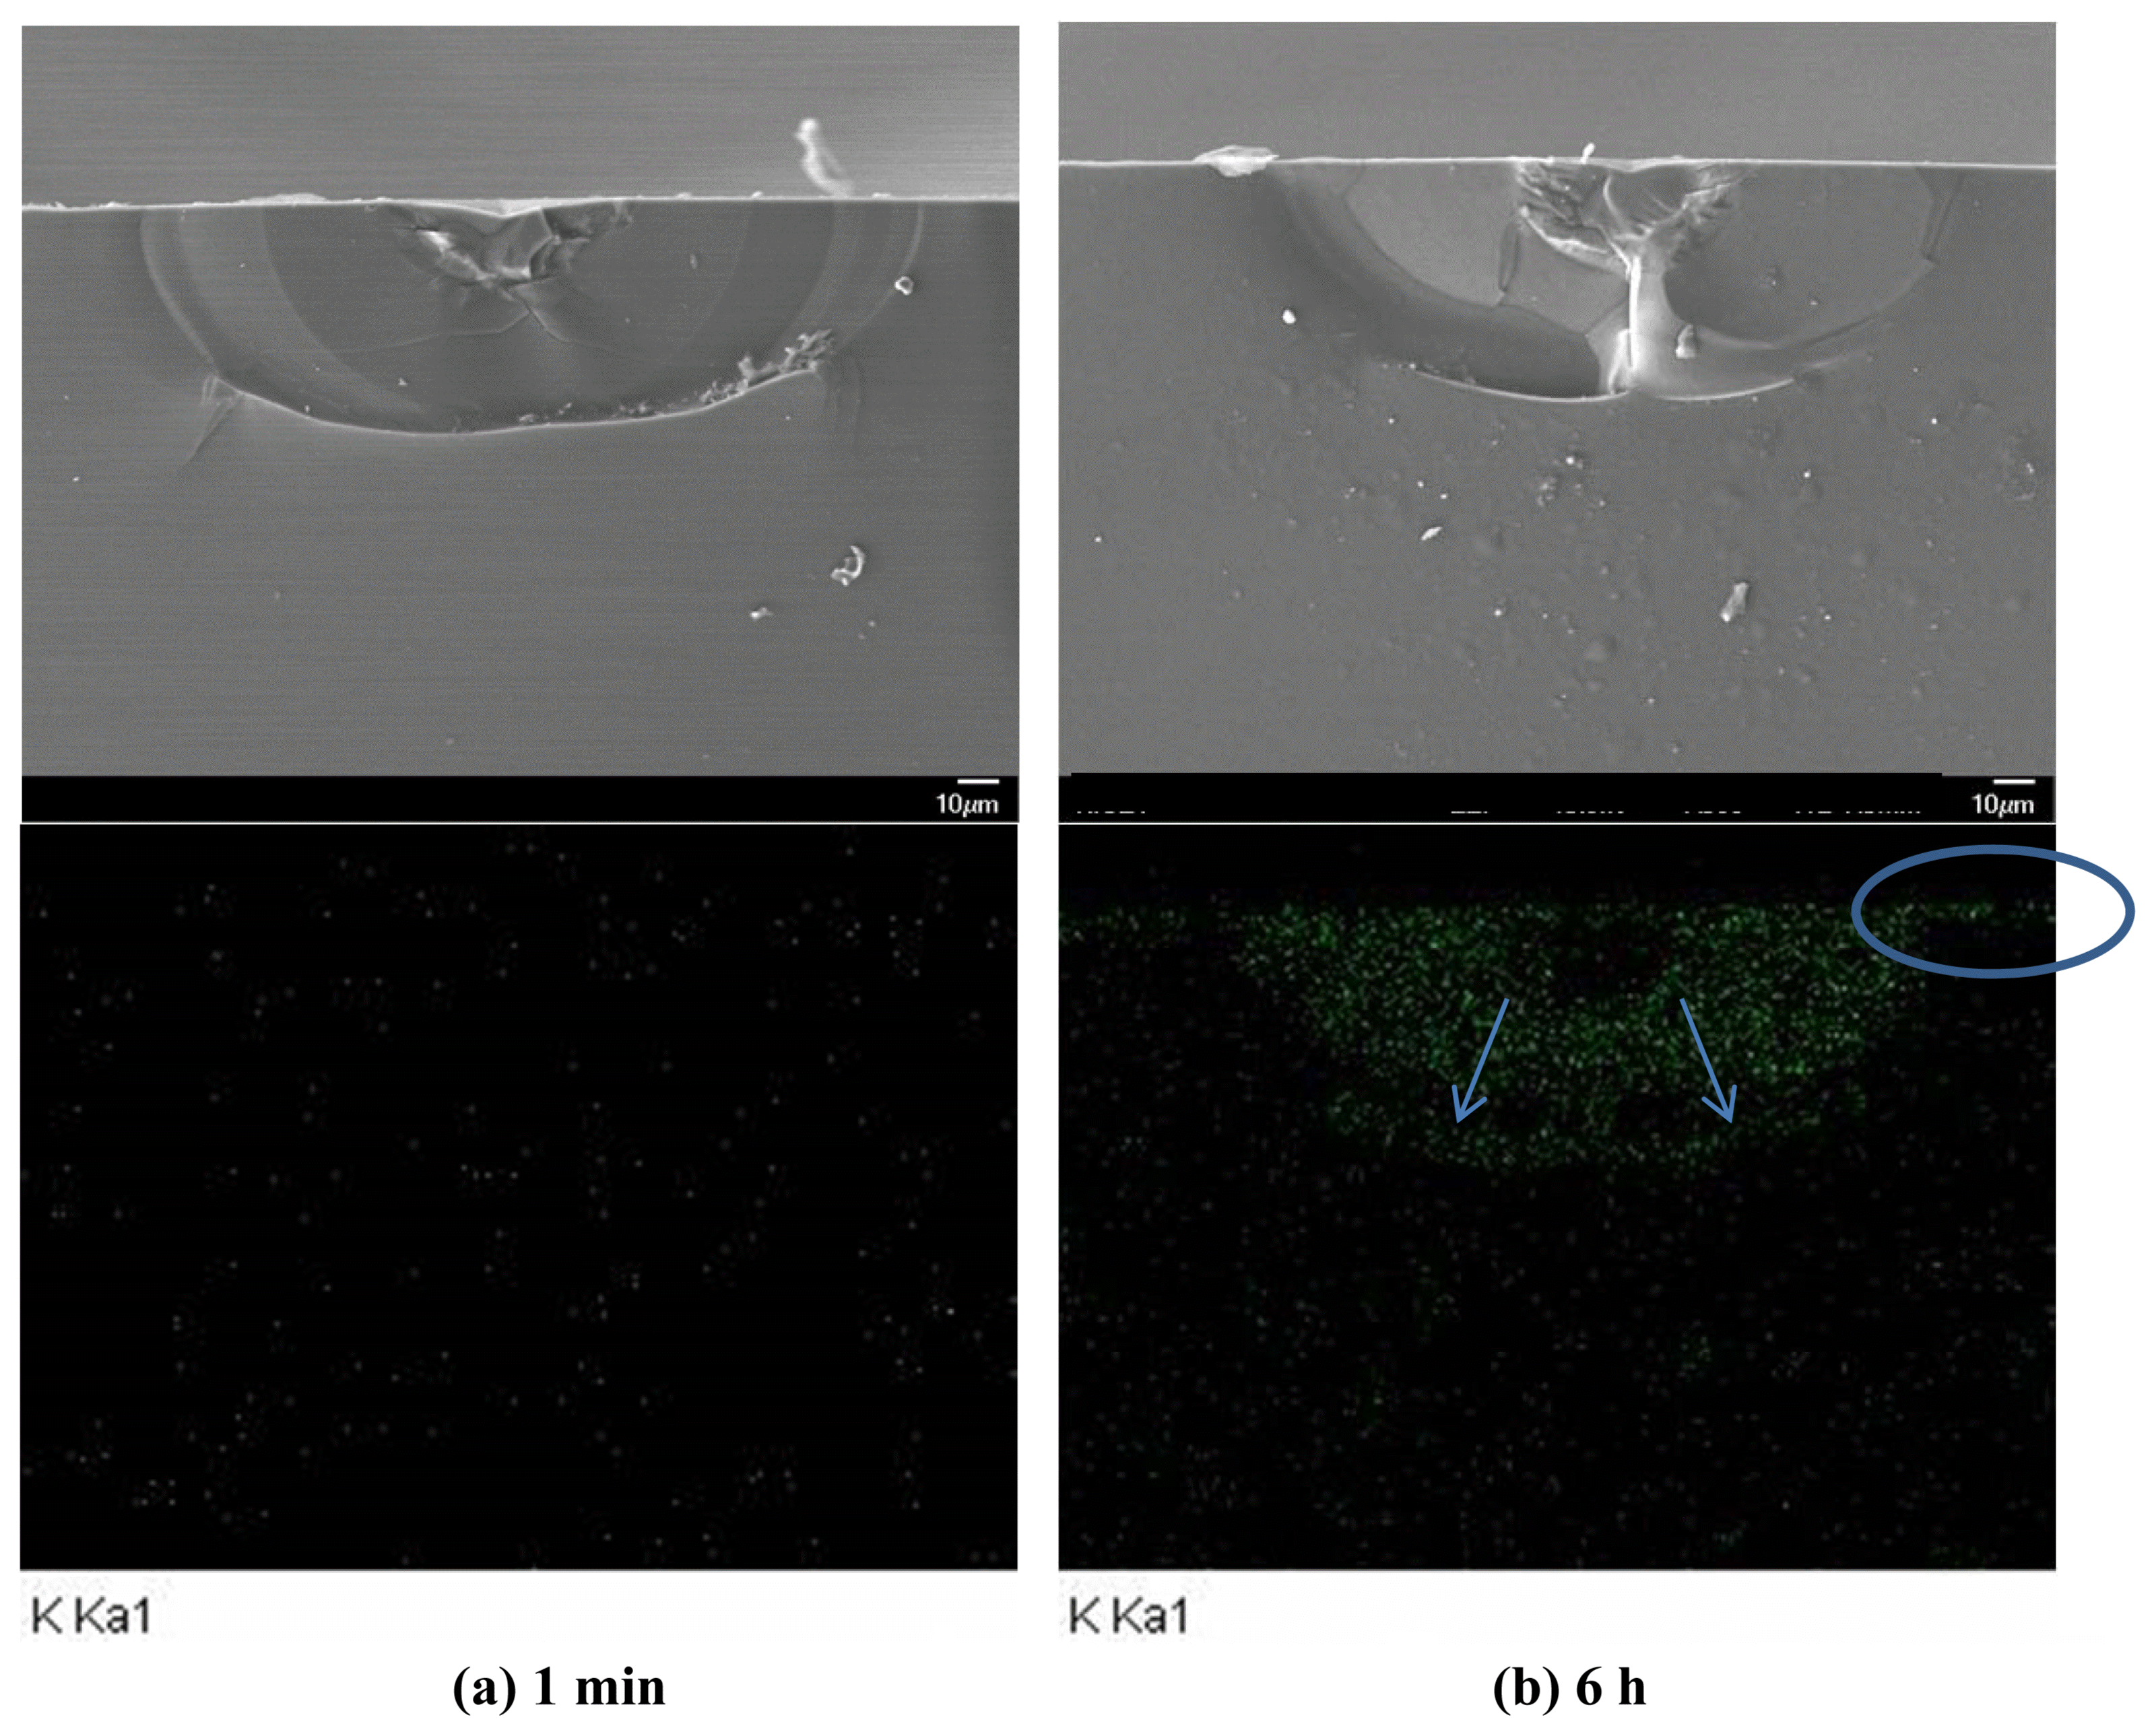
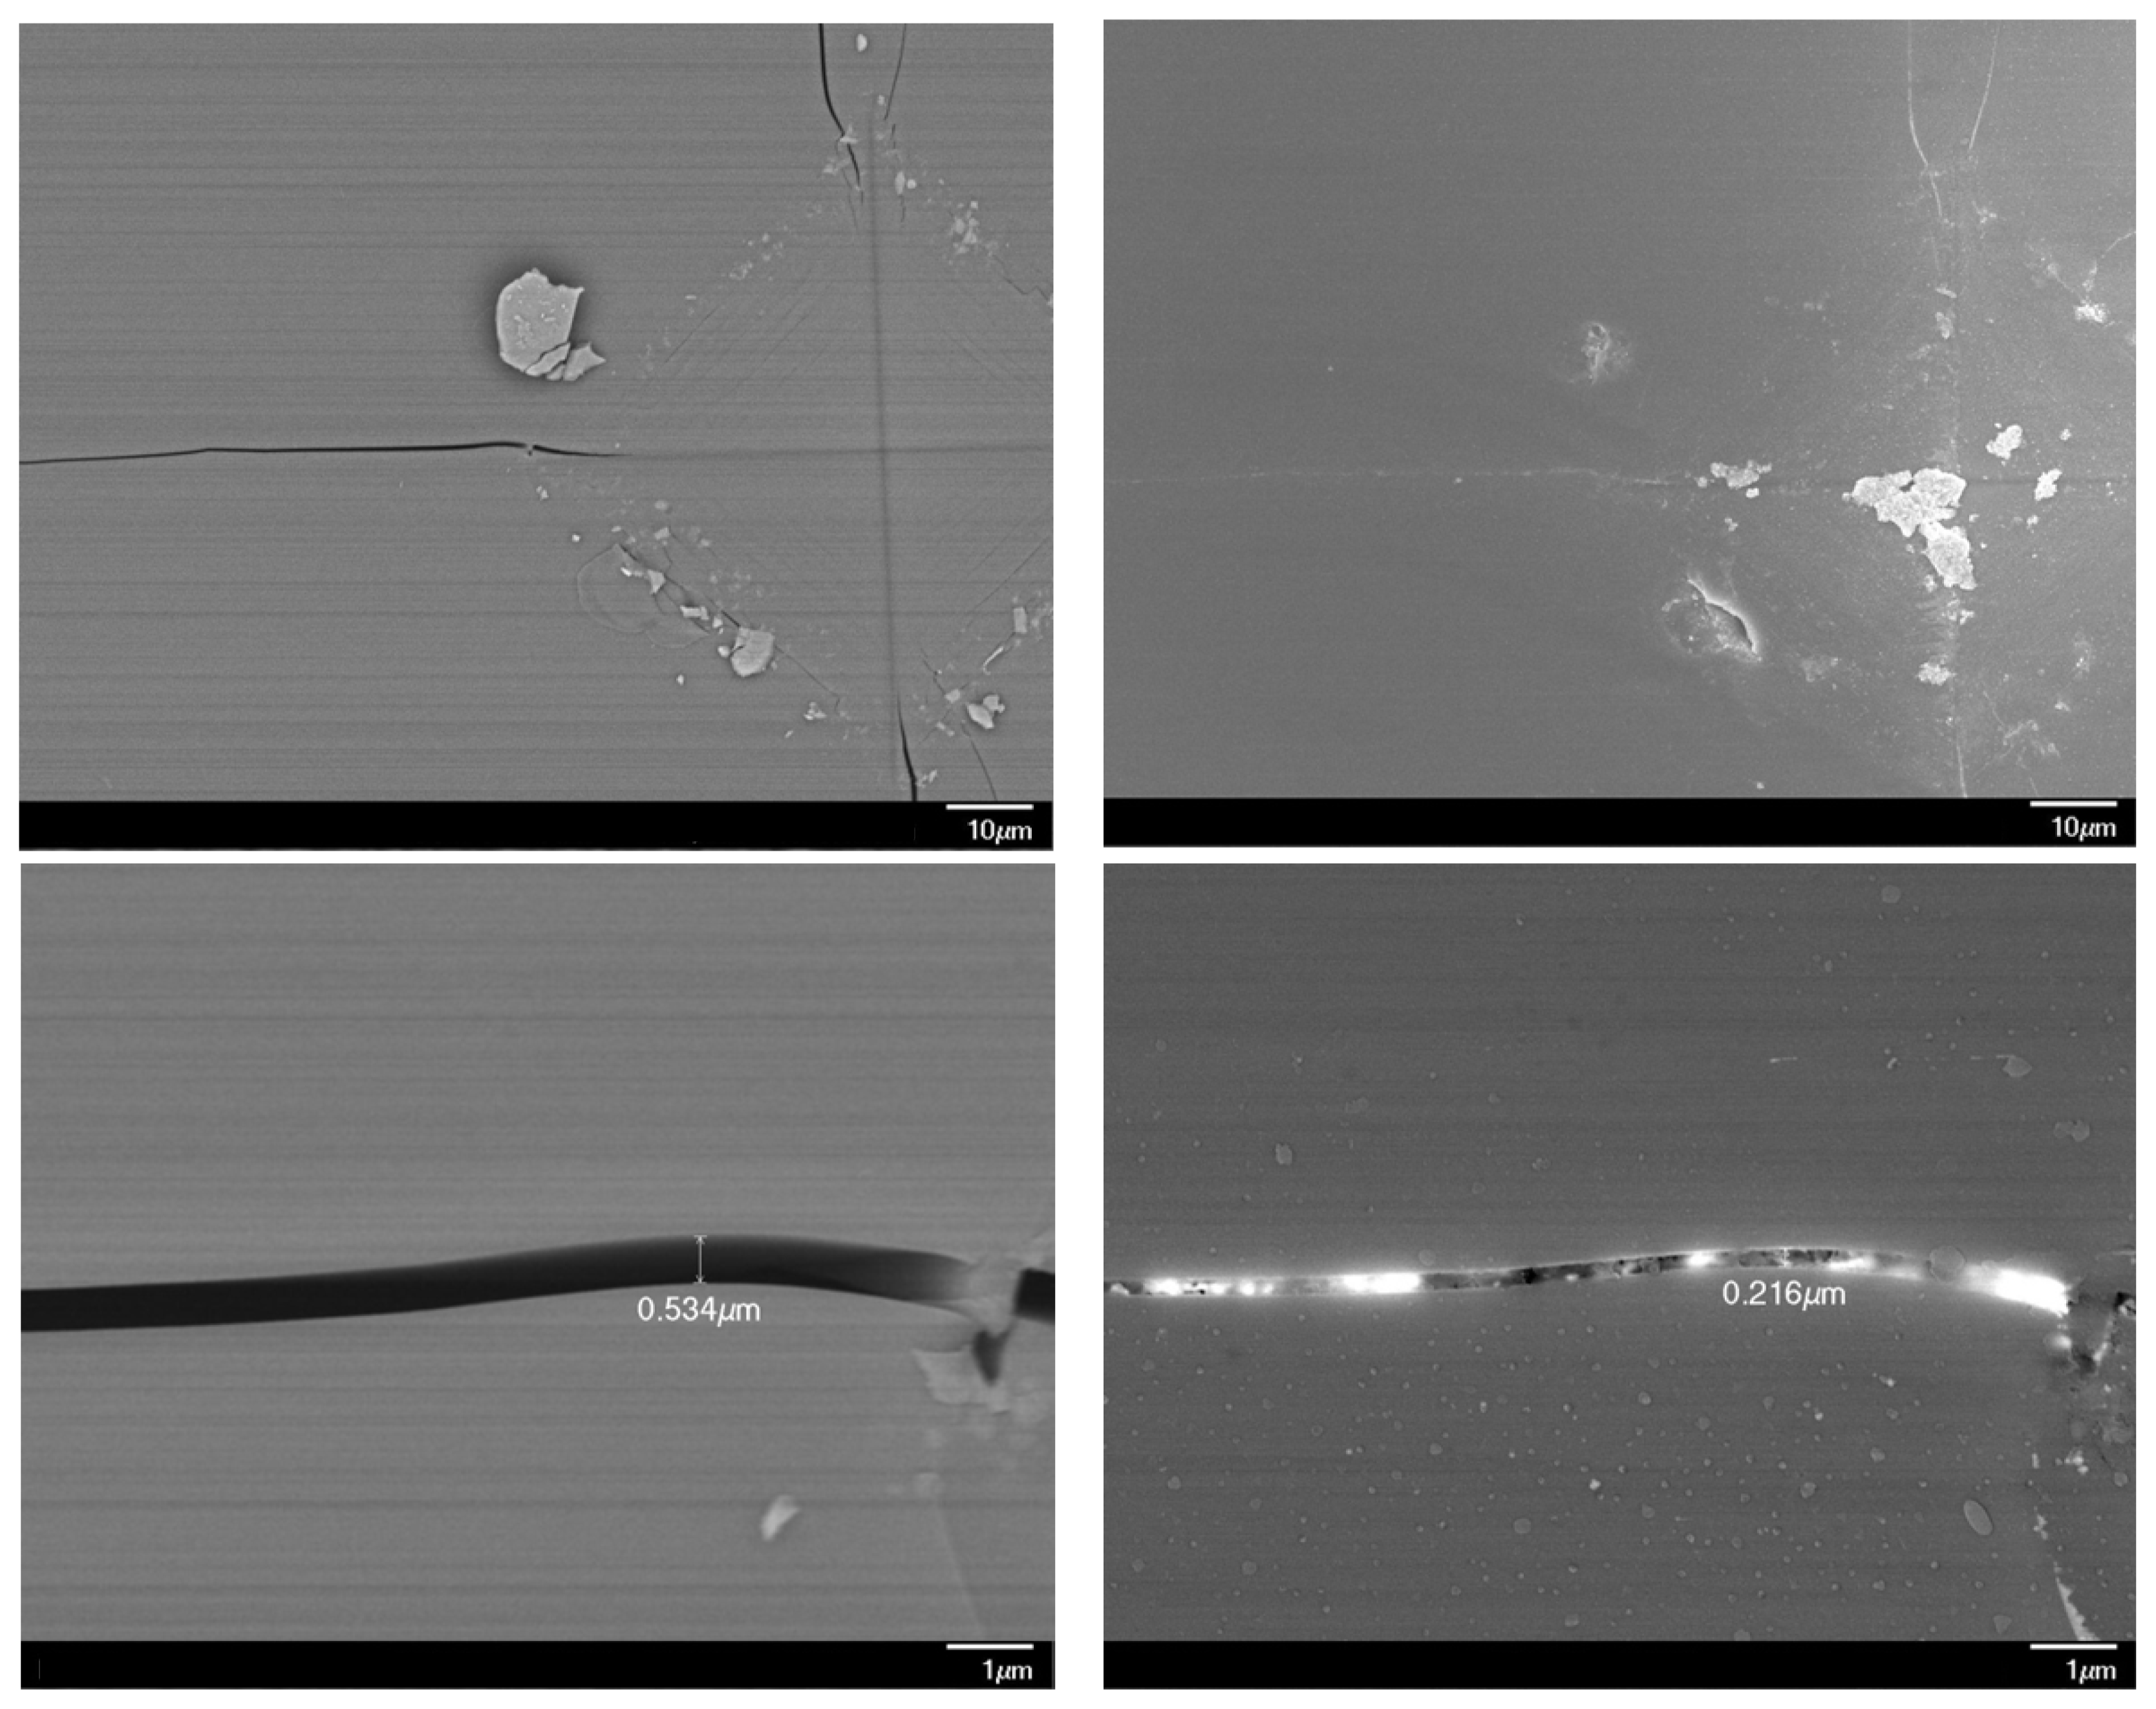
Figure 5 shows the distributions of potassium ions around the cracks generated by indenting the glasses strengthened for 1 min and 6 h. The results obtained from the EDS for the 6-hour tempered glass indicate that potassium ions are present on the surface of the generated radial cracks. This suggests that the KNO3 that melted during the chemical strengthening penetrated the cracks and filled the gap and that ion exchange and strengthening occurred at a depth, rather than at the surface. In other words, it is thought that the crack gap played the role of a capillary. Fig. 6 shows the change in the width of the crack generated by the indentation. After the strengthening, the crack narrowed. The crack width after the strengthening decreased from about 500 nm to about 200 nm near the starting point of the indentation. From Fig. 4, 5, and 6, it is thought that the KNO3 melt infiltrated the crack during the chemical strengthening and that the infiltration induced a volume expansion on the crack surface, generating a closing stress in the crack tip region.
The decrease in the stress intensity factor due to this closing stress, that is, the apparent fracture toughness increase, can be calculated as follows for the penny crack.12–14)
where c is the length of the crack, r is the distance from the center of the crack to the location within the crack, and σI(r) is the closing stress along the position r in the crack. The increase in the fracture toughness was calculated based on Eq. (1) and the resultant apparent K was used to estimate the flexural strength. Real cracks on a ceramic surface mostly reveal half penny shapes. The crack responsible for fracture would be the largest, and its surface would be perpendicular to the glass surface. For simplicity, the change in the stress intensity factor of the crack tip was calculated based on half penny shape. The calculation was further simplified by assuming that there is no influence of the residual stress due to the initial indentation. The maximum value of σI was assumed to be 670 MPa at the crack tip, which was similar to the measured residual stress, and assumed to linearly decrease from the crack tip to a point 50 μm away, where the crack opening due to indentation was mostly compensated by volume expansion as a result of the chemical strengthening. We called this the simple crack closing model. The results calculated based on the simple crack closing model (Fig. 7(b)) are shown by the dotted line in Fig. 8. The calculated and experimental values are not consistent with each other for variations in the indentation loads. This means that if the initial crack tip generated by an indentation is subjected only to the closure stress due to the chemical strengthening, as shown in Fig. 7(b), the experimental change in the strength due to the increase in the indentation load cannot be explained adequately. In other words, it does not describe the experimental result that there was little change in the strength when the indentation load was low, whereas the strength decreased drastically below specific threshold indentation load.
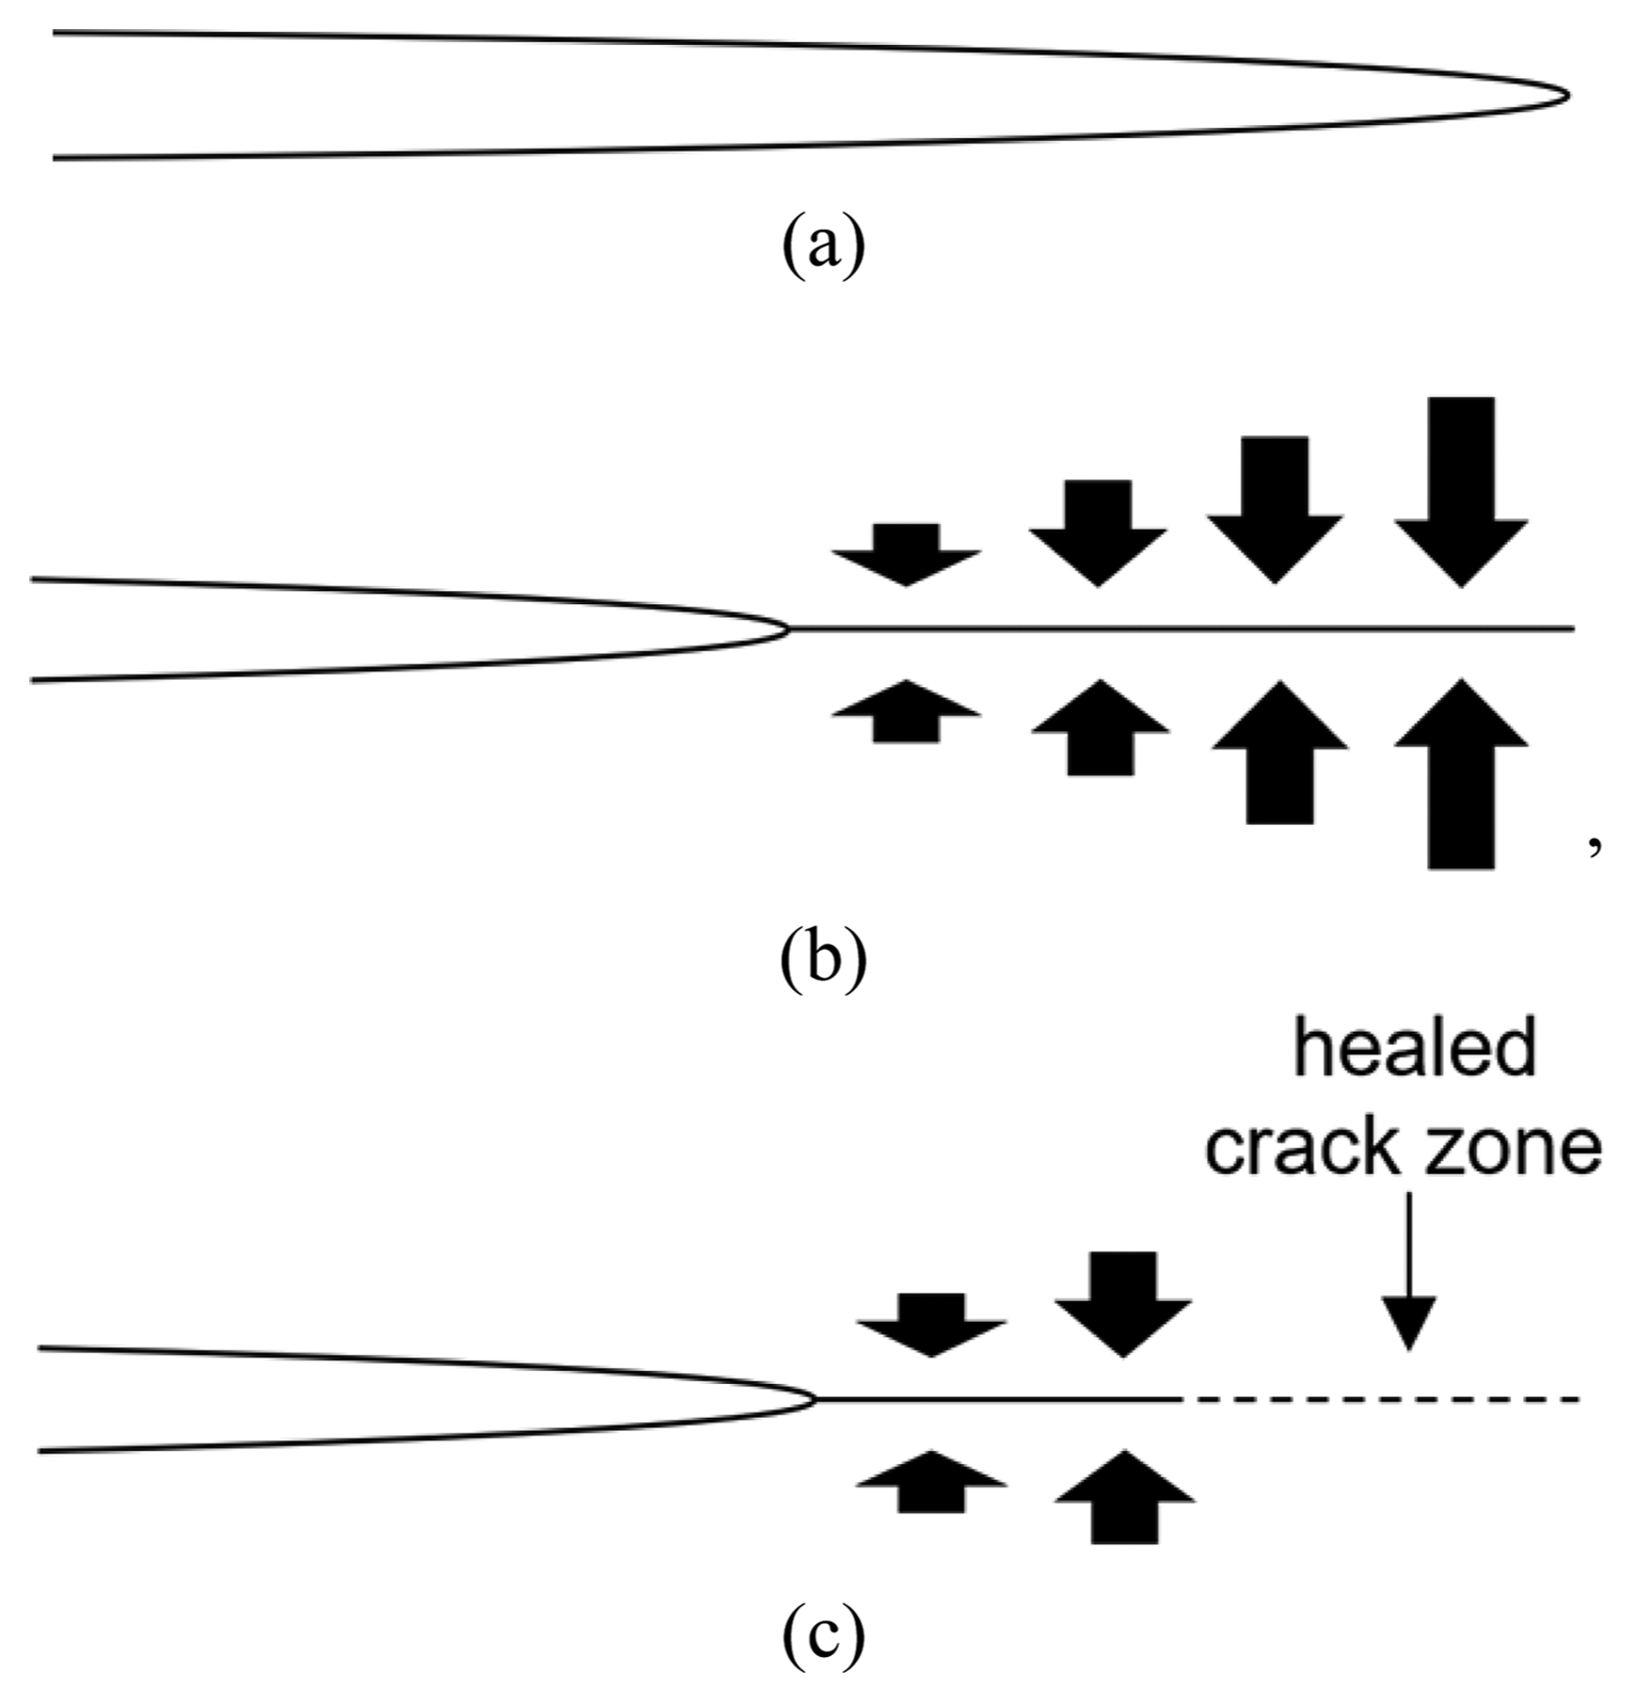
Schematics of crack profiles (a) before chemical strengthening, (b) after crack closure by chemical strengthening without healing, and (c) after crack closure with partial healing. The solid lines represent the crack profiles, whereas the dotted line indicates the healed crack zone (the arrows indicate the crack closing stress due to chemical strengthening).
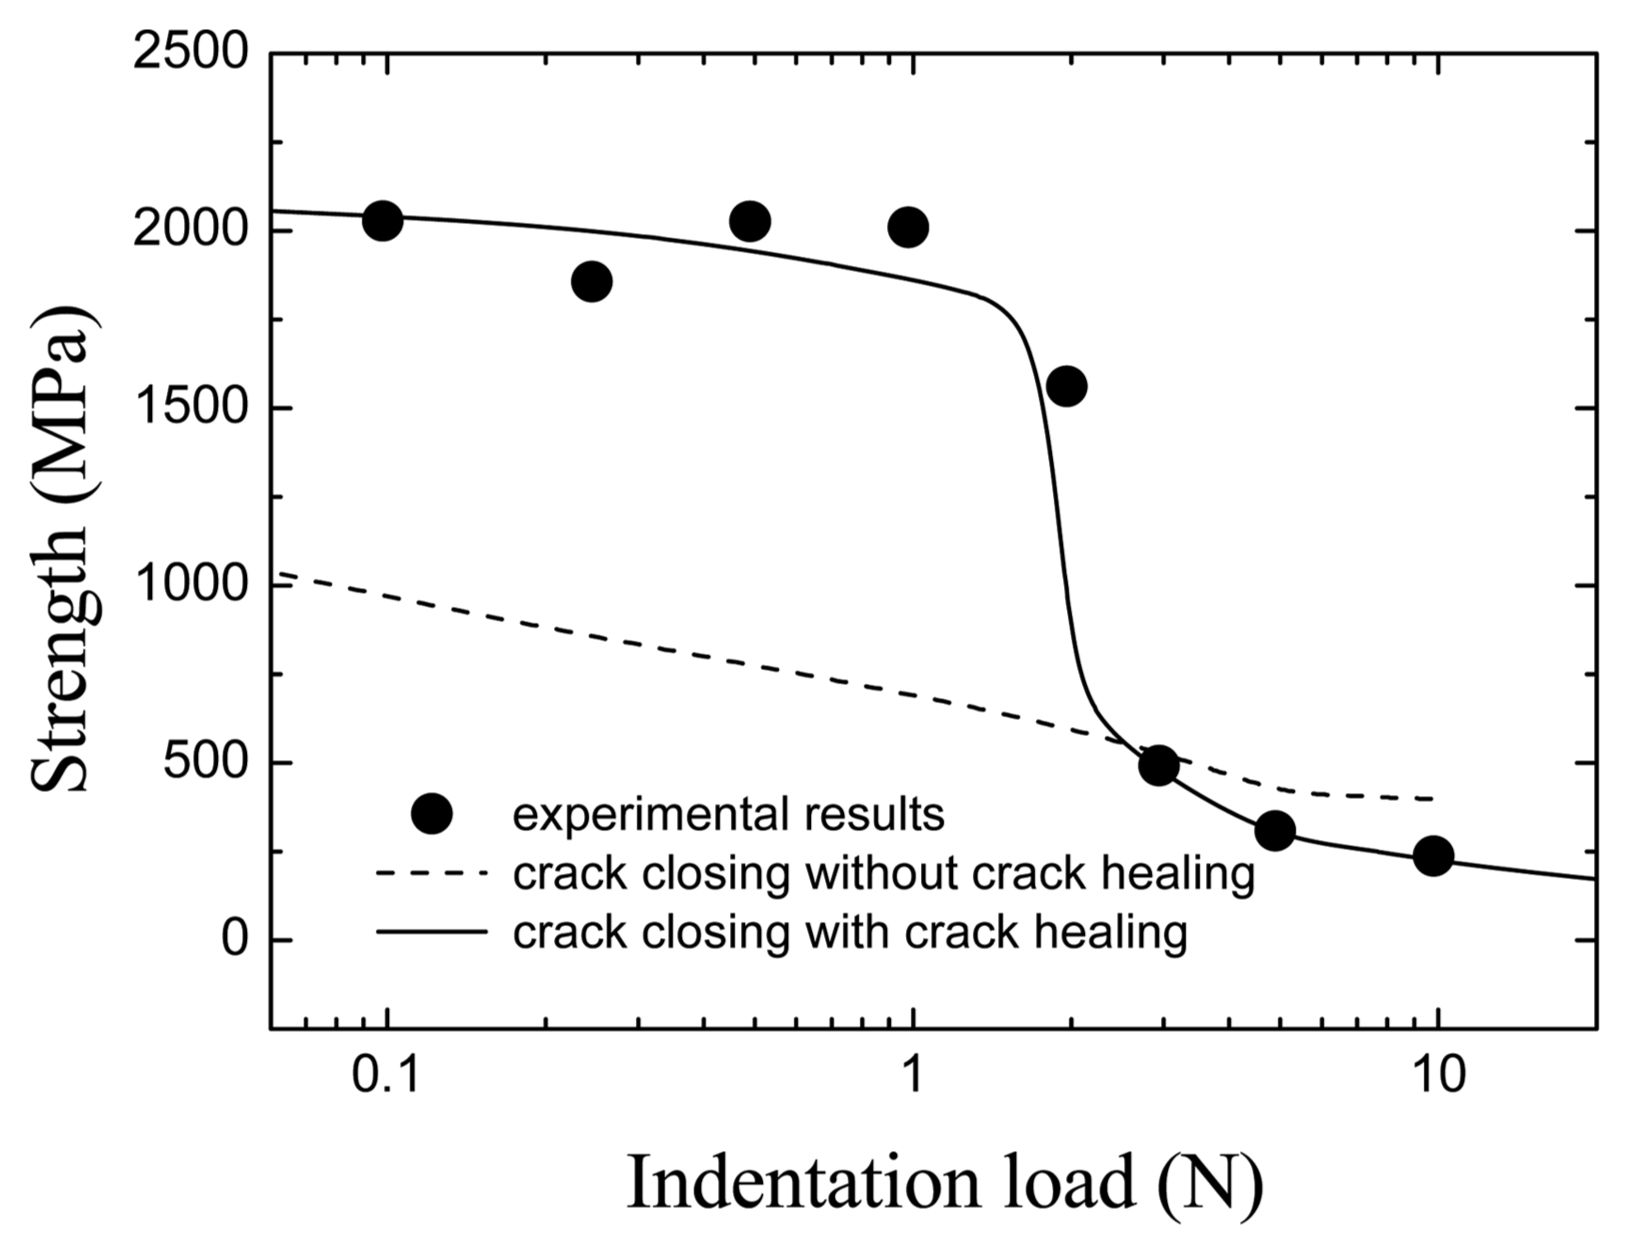
Comparison of the calculated strengths and the experimental results. The solid circles correspond to the experimental results, whereas the dotted line represents the results obtained based on a crack closing model without crack healing and the solid line represents the results for a crack closing model with crack healing.
On the other hand, a partial crack healing model, in which a part of the crack tip disappears during the chemical strengthening, can also be considered. When the maximum stress of 670 MPa is applied to the crack at 400°C for more than 6 h, crack healing may occur at the tip (Fig. 7(c)). The solid line in Fig. 8 represents the calculated strength when the chemical strengthening heals cracks up to 25 μm from the tip and the inherent handling crack size is 0.2 μm. The calculations are in good agreement with the experimental results, especially in revealing the tendency of strength reduction with the increase in the indentation load.
The agreement between the experimental results and the results obtained from the partial healing model of the cracks in Fig. 3 suggests that change in the strength of the glass after the chemical strengthening may occur for cracks of a certain size. In the case of this experiment, it can be interpreted that a glass having a crack of 50 μm (2c) or less displays healing, due to a high closing stress during the chemical strengthening, and exhibits a substantial (constant) strength. On the other hand, initial cracks longer than 50 μm (2c) are not completely healed even after the chemical strengthening, and the strength decreases suddenly and continuously with the increase in the indentation load. Nevertheless, since the residual stress acts on the remaining cracks, the stress intensity factor of Eq. (1) decreases, that is, the apparent fracture toughness is improved.
4. Conclusions
The purpose of this study was to investigate the effect of chemical strengthening and pre-existing micro cracks on the strength of glass and determine the minimum allowable crack size in glass for the chemical strengthening process. After cracks of various sizes were formed by using a Vickers indenter, the biaxial strength of the chemically strengthened glass was evaluated, and the following results were obtained.
Although the chemical strengthening depth in the soda-lime glass was less than 10 μm, the glass containing cracks of length 50 μm or less retained the strength of the glass without cracks, which was due to chemical strengthening. When cracks of lengths 50 μm or more were present in glass, the strength rapidly and continuously decreased with the increase in the crack size. In other words, it is considered that cracks of lengths 50 μm or less that were present in the glass before strengthening are healed by chemical strengthening.
Healing by chemical strengthening is believed to occur by the following process. During the chemical strengthening, the KNO3 melt penetrates and fills the cracks existing on the glass surface, which result in the exchange of sodium and potassium ions at the cross-section of the crack. It was concluded that the cracks closed and the healing phenomenon was caused by the compressive stress resulting from the volume expansion of the glass around the cracks by ion exchange.

