Nitrogen Doping in Polycrystalline Anatase TiO2 Ceramics by Atmosphere Controlled Firing
Article information

Abstract
A process for nitrogen doping of TiO2 ceramics was developed, whereby polycrystalline titania particles were prepared at 450–1000°C with variation of the firing schedule under N2 atmosphere. The effect of nitrogen doping on the polycrystallites was investigated by X-ray diffraction (XRD) and Raman analysis. The microstructure of the TiO2 ceramics changed with variation of the firing temperature and the firing atmosphere (N2 or O2). The microstructural changes in the nitrogen-doped TiO2 ceramics were closely related to changes in the Raman spectra. Within the evaluated temperature range, the nitrogen-doped titania ceramics comprised anatase and/or rutile phases, similar to those of titania ceramics fired in air. Infiltration of nitrogen gas into the titania ceramics was analyzed by Raman spectroscopy and XRD analysis, showing a considerable change in the profiles of the N2-doped TiO2 ceramics compared with those of the TiO2 ceramics fired under O2 atmosphere. The nitrogen doping in the anatase phase may produce active sites for photocatalysis in the visible and ultraviolet regions.
1. Introduction
The microstructural development of polycrystalline oxide ceramics having uniform grains, especially the synthesis of highly crystalline titania nanoparticles with controlled crystal structure, morphology, and size, has been a very active field in materials chemistry.1–6) In this study, we investigate nitrogen infiltration in TiO2 polycrystallites through firing at 430–1000°C under N2 gas atmosphere in a quartz tube furnace. TiO2 nanoparticles were obtained through the calcination of Ti(OH) powder, which was prepared by the hydrolysis of TiCl4 liquid. Nitrogen infiltration into the surface of the fired samples is investigated by Raman spectroscopy and XRD analysis. The formation of anatase and/or rutile phases is investigated by firing the samples under nitrogen gas or oxygen gas flow. The phase analysis by Raman and XRD was consistent with the microstructural transition observed by field-emission scanning electron microscopy (FE-SEM). XRD analysis confirms that anatase and/or rutile phases were generated according to the firing temperature. The loose structure of the anatase gel could be transformed to a nano-powder through drying and firing. The fine nanostructure is adequate for reacting with nitrogen gas.7–11)
2. Experimental Procedure
2.1. Preparation of anatase powders
As shown in Fig. 1 an aqueous solution of TiOCl2 was prepared by the hydrolysis of liquid TiCl4 (99.0% purity, Sigma Aldrich) through the addition of deionized (DI) H2O.12)
Process for formation of anatase sol and film coating on quartz glass substrate.
This hydrolysis reaction was exothermic and highly vigorous. 6) Fig. 2 shows the reaction system equipped with TiCl4 liquid bottle and a glass vessel for the hydrolysis reaction, that was especially designed to prevent a gas explosion during hydrolysis. The bottle with the TiCl4 precursor and the reaction vessel were kept in a bucket of salt/ice to slow the hydrolysis reaction, where the kinetics were controlled by slowly adjusting the N2 gas pressure. Addition of H2O to liquid TiCl4 results in vigorous evolution of chlorine gas, and the high pressure of the Cl2 gas may break the rubber stopper seal of the reaction vessel. The TiCl4 liquid was transferred from the TiCl4 precursor bottle to a glass reactor by using a cannula needle. The hydrolysis reaction system was connected to a gas control unit (Schlenk line)12–14) to allow control of the pressure of the N2 atmosphere during the reaction. The reaction vessel and TiCl4 bottle were kept under N2 atmosphere by consecutively applying a vacuum and inserting N2 gas (vacuum-gas exchange) into the Schlenk line system three times. The bottle and vessel were tightly packed by using stoppers and the vacuum-nitrogen gas exchange system.
Schematic of design for preparation of TiOCl2 aqueous solution from TiCl4 and electrodialysis reactor for preparing TiO2 powders from TiOCl2 aqueous solution.
2.2. Electrodialysis system
The obtained TiOCl2 solution was poured into the cationic chamber of an electrodialysis (ED) reactor,12) as shown in Fig. 2, and DI water was poured into the anionic chamber. As illustrated in Fig. 2, DC power was applied between the cathode (Pt electrode) and anode (Ti electrode). The DC voltage was between 0 and 50 V, and the applied current was under 50 A. Before applying DC power, the TiOCl2 solution in the cathode chamber was blue. From the initial stage of supplying DC power, Cl− ions in the cathode chamber move into the anionic chamber through the anionic membrane. With the removal of Cl− from the cationic chamber, the color of the slurry changed to dark violet and finally to black, indicating the completion of dechlorination of the aqueous TiOCl2 solution, that is, the formation of TiO2.
2.3. Calcination of TiO2 powder under N2 or O2 atmosphere
Anatase sol was coated on the surface of a quartz glass substrate and the anatase sol-coated glass was heat-treated in the quartz tube furnace under N2 or O2 gas flow (Fig. 3). Table 1 shows the sample notation. Firing was performed from 430°C to 1000°C for 70 min.

Furnace with atmosphere control using N2 or O2 gas flow.
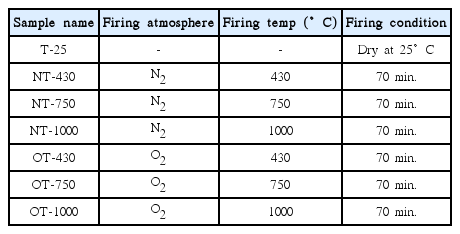
Firing Condition for the Prepared Samples
2.4. Characterization
The fired samples were characterized by using FE-SEM, X-ray diffraction (XRD), and Raman analysis. XRD (Bruker, M18XCE) was used for phase analysis of the dried powders at 25°C after the electrodialysis process and firing of the ceramic samples at 430–1000°C. The microstructure of the sintered body was investigated using FE-SEM (Hitachi, S-4800), showing a uniform microstructure throughout the samples. In order to analyze nitrogen incorporation into the surface lattice of TiO2, Raman spectroscopy (NTEGRA, NT-MDT Russia) was performed for the fired samples. Spectral analysis and curve fitting was performed with GRAMS/AI 8.00 Spectroscopy software.
3. Results and Discussion
3.1. Polycrystalline TiO2 ceramics prepared under N2 and/or O2 atmosphere
3.1.1. Preparation of TiO2 powders
As shown in Fig. 2, a specially designed experimental system was used for preparation of the anatase sol. In this device, there are two practical designs: one for low-temperature reaction using an ice bath and the other for partial pressure control in the Schlenk line using a N2 gas bomb and vacuum system. In a glove box, the TiCl4 reagent bottle was closely packed and fitted with a rubber stopper to prevent the sublimation of Cl2. Each side of the cannula line was inserted through the rubber stoppers of the TiCl4 bottle and glass reactor vessel. First, one side of the cannula was inserted deeply into the reactor vessel and the other was inserted half way into the rubber stopper of the TiCl4 bottle. By using a Schlenk line, the vacuum line was opened for 30 s and stopped, after which the N2 gas line was opened for a minute. This process was repeated twice and the cannula line was then fully inserted through the reactor vessel. Finally, the N2 gas line was open to maintain the partial pressure of N2 gas.
By pressure control of the N2 gas in the cannula needle, 18.88 g of TiCl4 solution in an ice bucket was moved into the reactor vessel in the ice-water bath. The glass reactor was cooled by keeping it in ice-water for 30 min before initiation of the hydrolysis reaction. To achieve slow hydrolysis at ice temperature, the connection tubes were sheathed with urethane foam tubes to prevent possible sublimation. The low N2 gas pressure and ice temperature are highly important experimental factors for preventing an explosive exothermic reaction. The rubber caps in the glass vessel and TiCl4 bottle were secured using copper lines. Liquid TiCl4 is explosively hydrolyzed if there is no control to maintain the low temperature and N2 gas pressure. If the system pressure rises due to gas evolution, the seal of the caps may be violently broken. Thus, we carefully controlled the amount of DI H2O added and monitored the temperature increase of the hydrated solution in the reactor. When DI H2O was added to the TiCl4 liquid to obtain TiOCl2, the highly exothermic reaction caused the temperature of the solution to rise sharply. However, this rapid increase of the solution temperature could be prevented through cooling in the ice bath. The slurry color gradually changed from colorless to pink and then to red upon termination of the hydration reaction. Termination of TiCl4 hydrolysis was indicated by a decrease in the gas evolution in the glass reactor.
When NH4OH was added during TiOCl2 formation, the Ti-(OH)2 complex [Ti(OH)2(H2O)n]2+ could be formed as a precursor of the TiO2 sol-gel.15,16) The aqueous solution of TiOCl2 was transferred to the ED reactor (Fig. 2) and DC power (50 V × 5 A) was then applied to remove the Cl− ions. Ten minutes after initiation of the ED process, the current in the yellow solution changed from 1.4 mA to 0.7 mA. After 2 h, the solution color changed from yellow to blue, and the current decreased to 0.3 mA. The ED process using similar devices is described elsewhere.12,17) The amount of blue-white powder slurry increased with time. With the progress of the ED reaction, the blue color changed to black and the current changed to 0.17 mA. After 20 h, the current decreased to 0.1 mA and a white gel was obtained, for which the degree of gelation was assumed to be ~ 80%. After 40 h, the current declined to 0.05 mA and only a white gel was observed. The ED reaction was stopped and the gel was transferred to a beaker and stirred with ethanol for 10 min. The gel was filtered and dried at 90°C in a drier.
3.1.2. Firing of polycrystalline TiO2 ceramics in N2 and/or O2 atmosphere
As explained in the Experimental section, TiO2 gel was coated on the surface of a quartz glass substrate and fired at 430–1000°C for 70 min in a tube furnace under N2 or O2 atmosphere, as shown in Table 1 and Fig. 3. FE-SEM, XRD, and Raman spectroscopic analyses of the samples are shown in Figs. 4, 5, and 6, respectively. The XRD pattern in Fig. 5 shows the formation of anatase and/or rutile phases with variation of the temperature under N2 or O2 atmosphere. 18,19)

FE-SEM micrographs of: (A) T-25, (B) NT-430, OT-430, NT-750, and OT-750, (C) NT-1000 and OT-1000.

(a) XRD analysis of T-25, T-430, T-750, and T-1000 samples. (b) XRD spectral details at 25.3° and 27.4°.

(a), (b) Raman spectra of T-25, T-430, T-750, and T-1000 samples.
3.2. Modification of microstructural surface by reduction firing under N2 atmosphere
3.2.1. FE-SEM
Figure 4 shows the changes in the microstructure according to the firing schedule and atmospheric conditions employing N2 or O2. The 1 μm magnification images in Fig. 4(a) show that the T-25 sample, which was simply dried at 25°C, comprised uniform particles with a diameter of several tens of nanometers. As mentioned in relation to the ED process, the prepared powder slurries were filtered by using ethanol to obtain uniform powders. However, the 10 nm powder agglomerated to form μm-sized domains, as shown in the images at 1, 5, and 10 μm magnification, respectively. The goal of this research was to fabricate nitrogen-doped anatase ceramics by firing TiO2 polycrystalline powder under N2 gas at 430–1000°C. Fig. 4(b) shows particle diameters of ~ 12 nm for NT-430 and ~ 15 nm for OT-430. The particle diameter of NT-430 was smaller than that of OT-430. The particle diameters for NT-750 and OT-750 were 20–100 nm and 30–200 nm, respectively. At higher firing temperatures, particle growth was significant, and the particle diameter for OT-750 was much larger than that of NT-750. The crystallites of the samples fired at 1000°C (Fig. 4(c)) were much larger in the case of NT-1000 than OT-1000.
Figure 4(b) shows particle diameters of ~ 20–100 nm for NT-750 and ~ 30–200 nm for OT-750. The particle diameters were ~ 100–300 nm for NT-1000 and ~ 90–200 nm for OT-1000 (Fig. 4(c)). Notably, the TiO2 ceramic samples fired at 750°C comprised mixed crystal phases of anatase and rutile, and the TiO2 samples fired at 1000°C comprised the single rutile phase. The relationship between the crystal morphology development and crystal phases is discussed in the next section.
It is proposed that nitrogen atoms were incorporated into the surface layers of the TiO2 particles; thus, the formation of a tight lattice space limited the growth of anatase TiO2 crystallites. It is known that the lattice constant of TiN is ~ 4.24 Å [JCPDS 65-0715].20,21) The lattice constants of TiO2 are 3.7821 Å and 4.5937 Å for anatase22) and rutile,23) respectively. That is, the surface lattice of anatase TiO2 will expand due to nitrogen infiltration and inhibit the growth of the TiO2 particle grain.
3.2.2. XRD and Raman analysis
Figure 5 shows the XRD patterns for the samples listed in Table 1. NT-430 and OT-430 respectively comprised a single phase of anatase crystallites, where the XRD patterns were similar despite the use of N2 or O2 atmosphere. A single rutile phase was observed for OT-1000 and NT-1000. Mixed phases of anatase and rutile appeared for OT-750 and NT-750. Formation of the crystal phase was not critically affected by the atmosphere used for firing, but the firing atmosphere caused slight changes in the XRD peak intensity and spectral patterns, as shown in Fig. 5(b). For the T-430 samples, the intensity of the peak at 25.3° for the O2-fired sample was relatively higher than that of the N2-fired sample, whereas for the T-750 and T-1000 samples, the intensity of the peak at 27.4° for the O2-fired sample was lower than that for the N2-fired counterpart. The XRD peaks at 25.3° and 27.4° correspond to the anatase phase and rutile phase, respectively.
From the XRD analysis in Fig. 5(a), (b), the T-25 sample shows broad bands, indicating nano-crystalline phases, and samples such as T-430, T-750, and T-1000 show higher crystallinity with increasing firing temperature. For NT-750 and OT-750, the rutile phase was predominant, with the formation of some anatase phase, and the XRD patterns were similar for both samples. For NT-1000 and OT-1000, a single phase of rutile was developed, indicated by the strongest peak at 27.4° in Fig. 5(b) and the other strong peaks in Fig. 5(a). N2 reduction firing of the T-750 and T-1000 samples led to higher intensity of the 27.4° peak, compared to that observed with oxidation firing. Notably, the intensity variation was more pronounced for the T-1000 samples. That is, the XRD peaks of the rutile phase were much more intense for the sample fired under N2 atmosphere (NT-1000) than that fired under O2 atmosphere (OT-1000). However, the peaks of the anatase phase were more intense for the sample fired under O2 atmosphere (OCT-430) than for that fired under nitrogen atmosphere (NT-430). Firing of the T-750 sample under different atmospheres led to a mixed phase of rutile and anatase in NT-750 and OT-750, where the intensity of the respective peaks of anatase and rutile at 25.3° and 27.4° showed little variation.
This observation means that nitrogen might be well incorporated into the surface lattice of the rutile TiO2 crystals, but N2 reduction firing might induce oxygen deficiencies24) in the anatase TiO2 crystal lattice of the NT-430 sample. The formation of the crystal phase is determined by the firing temperature, but N2 reduction may affect the lattice interactions in the anatase and rutile phases. As a result, it is proposed that in the anatase phase, N2 reduction firing induces oxygen lattice deficiencies in the crystal surface, resulting in lower intensity of the XRD peaks, whereas in the rutile phase, nitrogen may be incorporated into the oxygen deficient lattice during N2 reduction firing, resulting in increased intensity of the XRD peaks.
Figure 6 shows the Raman spectra for the TiO2 powder samples fired under N2 or O2 atmosphere.24–27) NT-430 shows Raman peaks at 146.17, 396.2, 516.0, and 640.2 cm−1, respectively. NT-1000 shows three typical peaks at 236.9, 446.4, and 610.0 cm−1, respectively. T-750 shows the typical peaks observed for T-430 and T-1000. The Raman peaks of the T-750 samples (Fig. 5 and Fig. 6) appear to correspond to the XRD patterns of the rutile and anatase phase in both NT-750 and OT-750.
The Raman profile of the T-25 samples shows a typical peak at 153.0 cm−1 in Fig. 6(b) and weak broad bands at 396, 516, and 640 cm−1 in Fig. 6(a). The Raman peak at 153.0 cm−1 may originate from the nano-crystalline anatase phase, which is identified by the broad XRD peak at 25.3° in Fig. 5(b).
The spectra of the T-430 samples show a typical peak at 145.45 cm−1 for OT-430 and at 146.17 cm−1 for NT-430 (Fig. 6(b)), and weak broad bands at 396.2, 516.0, and 639.37 cm−1 in Fig. 6(a), respectively. The Raman peaks of T-430 were stronger than those of T-25. Fig. 5 shows similar peak development in the XRD patterns of the T-430 samples, definitively indicating a single phase of anatase crystallites. Notably, the Raman spectra were influenced by the phase development of the anatase crystallites. Compared to that of T-25, the Raman spectrum of T-430 showed more pronounced peaks, which may correspond to the development of the XRD patterns in Fig. 5. The band at 146.17 cm−1 in the Raman profile of NT-430 (Fig. 6(b)) is more intense and slightly blue shifted relative to that at 145.45 cm−1 for OT-430. Fig. 6(b) shows the strongest Raman bands for NT-750 and OT-750, indicating a small red shift to 143.19 cm−1 for NT-750 compared to the peak at 143.85 cm−1 for OT-750. The Raman spectrum of NT-1000 (Fig. 6(a)) shows the strongest bands and a slight red shift of the bands at 447 cm−1 and 610 cm−1 for NT-1000 and OT-1000, respectively. For NT-750 and OT-750 (Fig. 6(a)) strong Raman bands were observed at 447 cm−1 and 610 cm−1, with a slight red shift in the case of NT-750. Fig. 6(b) shows strong Raman bands at 143.85 cm−1 for OT-750 and 143.19 cm−1 for NT-750, indicating a slight red shift in the case of NT-750. For the T-750 samples, the band shift was too small for quantitative estimation. Weak, broad bands of the anatase phase were observed at 396.2, 516.0, and 640.2 cm−1, and peaks of the rutile phase were observed at 236.9, 446.2, and 610.0 cm−1, respectively. The Raman peaks of T-750 were strongly developed compared to those of nanocrystalline TiO2 in T-25. The strongest anatase peaks appeared at 145.19 cm−1 for NT-750 and 143.85 cm−1 for OT-750. The T-1000 samples showed very weak Raman peaks at 146.6 cm−1 and 236.9 cm−1, indicating a small amount of the anatase phase, and major peaks of the rutile phase were observed at 236.9, 447.3, and 610.0 cm−1.
A minor band shift was observed for NT-750 and OT-750. The band shift corresponds to the phonon vibration of the Ti-O or O-O sub-lattice of the surface of the formed TiO2 phases.25) The Raman peaks of the NT-430 samples were confirmed to be blue-shifted relative to those of OT-430. For NT-1000 and OT-1000, it was difficult to quantitatively evaluate the red shift.
3.3. Discussion
Based on the D4h space group for anatase and assumed site symmetries for the Ti and O atoms within the unit cell (D2d for Ti; C2v for O), the anatase phase of the TiO2 crystallites has six Raman active “lattice vibration” modes [A1g (513 cm−1) + 2B1g (399 cm−1, 519 cm−1, 639 cm−1) + 3Eg (144 cm−1, 197 cm−1, 639 cm−1).27) Anatase in T-430 exhibits Raman bands at 146 cm−1 (Eg1), 396 cm−1 (B1g), 516 cm−1 (A1g), and 640 cm−1 (Eg3). From the reported crystallographic Ti-O bond lengths for bulk anatase28) and covalence/length/Raman frequency relations,29) the observed Raman bands at 396, 516, and 640 cm−1 are consistent with the moderately distorted TiO68− octahedron in anatase.25,29) The O-O covalent interactions correspond to the peaks at 236.9 and 396.2 cm−1. The sharp peak at 144.6 cm−1 is consistent with Ti-Ti bonding in the octahedral chains, with a reported Ti-Ti bond length of 2.96 Å. The Eg anatase mode shows a blue shift and asymmetric broadening, especially for the peak at 144 cm−1 (Fig. 6(b)), which may be related to the variation of the dimensions of the nanoparticles.
At higher oxygen annealing temperature, the relative amount of rutile increased, as evidenced by the higher relative intensity of the Raman bands at 236.9, 446.4, and 610.0 cm−1. For T-750, both anatase and rutile are present, with rutile being the dominant phase. The anatase-to-rutile transformation on Ti metal in polycrystalline TiO2 is initiated at much lower temperatures, attributed to oxygen vacancies located at the metal/oxide interface, and is likely to be associated with an increase in the photocurrent density. 24,30,31)
From the reported Raman spectral analysis24) by Lorentzian and Gaussian multi-peak fitting, there are some general trends in the peak positions: anatase Eg mode - blue shift; maximum shift of 3 cm−1, rutile Eg mode - red shift; maximum shift of 10.7 cm−1, rutile Ag mode - random shift; maximum shift of 4.2 cm−1. The thermodynamically stable rutile phase exhibits major peaks at 247, 446, and 610 cm−1 and minor peaks at 319 and 707 cm−1. Based on the D4h space group for rutile and the assumed site symmetries for the Ti and O atoms within the unit cell, group-theoretical analysis shows five Raman-active “lattice vibrations” assigned as follows: B1g (144 cm−1) + multi-proton process (236 cm−1) + Eg (446 cm−1) + A1g (610 cm−1) + B2g (827 cm−1).24) The reported Ti-O bond lengths for rutile29) are consistent with the observed Ti-O bands at 446 cm−1 and 610 cm−1. The O-O interactions correspond to the 236.9 cm−1 peak. The broad band observed near 160–240 cm−1 is assigned to O-O interactions involving three- and four-coordinate oxygen. The sharp feature at 143 cm−1 is consistent with Ti-Ti covalent interactions. Rutile titanium cations are hexa-coordinated to oxygen anions, forming distorted octahedra joined by edge-sharing of the TiO68−octahedra.
For T-750 comprising mixed rutile and anatase phases, the Raman scattering cross-sections of anatase and rutile changed as the degree of crystallinity changed. Thus, we could not quantitatively evaluate the weight ratio of rutile to anatase, but in the case of the T-750 samples, the intensity of the Raman peaks of NT-750 was much higher than that of OT-750 at 396.2 cm−1 and 446.4 cm−1. The Raman bands at 396.2 cm−1 and 446.4 cm−1 correspond to the anatase and rutile phase, respectively, where there was a slight shift in both band frequencies for oxidation versus reduction firing.
In literature analysis of the Raman features24,25) of the rutile phase, a red shift attributed to non-stoichiometric effects was reported for the Eg rutile mode. The XRD and Raman spectra confirm variations of the surface lattice in polycrystalline TiO2 during N2 or O2 firing. The incorporation of nitrogen into the lattice of nanocrystalline TiO2 is influenced to different degrees by the chemical activity of the TiO2 powder and nitrogen atmosphere such as N2/Ar gas, NH4OH, NH4Cl, aldehyde, or urea.7–9) For the N2 gasfired TiO2 sample7) a decrease in the photocatalytic activity was reported for the powder form, despite the lack of any noticeable change in the XRD spectrum.
Generation of oxygen deficiencies and/or nitrogen incorporation into the surface lattice of polycrystalline TiO2 may result in photocatalytic activity under visible light or ultraviolet (UV) irradiation.24,25) It is known that the anatase phase is photocatalytically active under UV irradiation, and nitrogen-infiltrated anatase may be photocatalytically active under visible light.7–9) The TiO2 powder fired under N2 atmosphere may be photocatalytically active under visible light,30,31) with multiple prospective applications under solar irradiation. The photocatalytic effect may be greatly influenced by the incorporation of nitrogen atoms into the TiO2 polycrystalline surface, which is the subject of a future report. The formation of TiO2 nano-crystallites and uniform bulk ceramics having three-dimensionally ordered crystallites with micro-, macro- and meso-scopic pores are the technical issues to be addressed for further practical applications.
4. Conclusions
TiO2 nano-powders were prepared via hydrolysis of TiCl4 and an electrodialysis process, and fired under N2 and/or O2 atmosphere at 430–1000°C. Nitrogen incorporation in TiO2 ceramics was investigated by XRD and Raman analysis. Some variations in the microstructure of the nitrogendoped TiO2 ceramics were observed. With variation of the firing temperature, the phase change was not critically different in spite of firing under different (N2 or O2) atmospheres. However, there were large variations in the Raman spectra, and it is concluded that this variation is closely related to the microstructural changes.
Acknowledgments
This research was supported by the general research support program of the National Research Foundation (NRF), funded by the Korean Government (NRF-2017R1D1A1B 03032397).