Development of Highly Conductive and Corrosion-Resistant Cr-Diamond-like Carbon Films
Article information

Abstract
Cr-diamond-like carbon (Cr-DLC) films were deposited using a hybrid method involving both physical vapor deposition and plasma-enhanced chemical vapor deposition. DLC sputtering was carried out using argon and acetylene gases. With an increase in the DC power, the Cr content increased from 14.7 to 29.7 at%. The Cr-C bond appeared when the Cr content was 17.6 at% or more. At a Cr content of 17.6 at%, the films showed an electrical conductivity of > 363 S/cm. The current density was 9.12 x 10⁻² μA/cm2, and the corrosion potential was 0.240 V. Therefore, a Cr content of 17.6 at% was found to be optimum for the deposition of the Cr-DLC thin films. The Cr-DLC thin films developed in this study showed high conductivity and corrosion resistance, and hence, are suitable for applications in separators.
1. Introduction
Diamond-like carbon (DLC) films are amorphous carbon coating films with a combination of sp2 graphite and sp3 diamond structures. DLC thin films exhibit high hardness, chemical stability, excellent abrasion resistance, and high corrosion resistance comparable to those of diamond, and hence find applications in various fields, particularly in automotive parts. Various studies have been carried out to develop automotive parts with high fuel efficiency, low friction, and high corrosion resistance. However, the insulating properties of DLC coatings limit their applications in automotive parts. In order to overcome this limitation, efforts have been made to improve the conductivity of DLC coatings by doping them with various metals such as Ti, Cr, Cu, Mo, and W. However, since metals tend to ionize, they deteriorate the corrosion resistance of DLC films when doped into them. Therefore, a novel thin film deposition method should be developed to improve the electrical conductivity of DLC films while maintaining their corrosion resistance.1–17) DLC films with high electrical conductivity and corrosion resistance can be used as separators in automotive fuel cells. The separator serves as a channel for supplying the fuel and oxidant to the anode and cathode. It performs various functions such as collecting and delivering the generated current, transporting and removing the reaction product, and discharging the reaction heat. Graphite separators are widely used in automotive fuel cells owing to their good corrosion resistance and light weight. However, they are fragile, thick, relatively expensive, and difficult to process. Therefore, it is imperative to develop low-cost thin films with good corrosion resistance and electric conductivity.18–24) Hence, in our previous study, we used Ti to improve the conductivity and corrosion resistance of DLC films. We also carried out the wear tests of the DLC films. The films showed high friction coefficients, and hence could not be used for automobile applications. Therefore, in this study, we employed a hybrid method involving physical vapor deposition (PVD) and plasma-enhanced chemical vapor deposition (PECVD) at room temperature for the deposition of thin films with good conductivity and corrosion resistance. The effect of the Cr content on the conductivity and corrosion resistance of the Cr-DLC thin films was investigated. The structural and chemical properties of the Cr-DLC thin films were investigated to determine the optimum Cr content. We also investigated the feasibility of obtaining thin films with excellent wear characteristics for application as separators.
2. Experimental Procedure
2.1. Deposition of the Cr-DLC films
The substrates used in this study were a Si-wafer, STD11, and SUS304. The surface of STD11 was polished to #200–#2000 using a sand paper. Prior to the deposition of Cr-DLC films, all the substrates were pretreated ultrasonically using methyl alcohol for about 10 min. After loading the treated substrates into the chamber, the base pressure was reduced to 2 × 10⁻⁶ Torr.
The Cr target (99.9%) was cleaned for more than 30 min by applying a DC power in an Ar gas atmosphere in order to remove the impurities present on its surface. Plasma cleaning was carried out subsequently for 30 min by applying a DC-pulsed power of 550 V at 10 × 10−3 Torr in an Ar gas atmosphere. To improve the adhesion between the substrate and the DLC films, a hybrid method was employed. During PVD, the DC power connected to the sputter was controlled for Cr doping, while CVD was used to deposit the DLC films. Cr was deposited to its thickness of about 0.3 μm as a buffer layer using the Cr target and DC power. Then, Ar and C2H2 gases and a 500 V-DC pulsed power were applied to the substrate to deposit the DLC film on the buffer layer, while Cr-DLC was deposited by applying DC power at the same time. At this time, an increase in the Cr content increased the corrosion rate of the film because of the presence of the metal. Thus, in order to minimize the Cr content, the DC power was varied from 0 to 200 W while the shutter on the target was turned on and off after every 5 min. This resulted in the generation of the layered DLC and CR-DLC structures. The entire deposition process was carried out at room temperature. Figs. 1 and 2 show the schematic of the experimental set-up. Table 1 lists the process conditions. The total thickness of the Cr-DLC coating was fixed at approximately 1 μm by adjusting the deposition time.

Schematic of hybrid equipment.

Sequence of Cr-DLC thin film deposition.
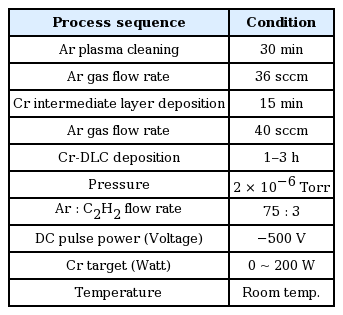
Cr-DLC Process Conditions
2.2. Characterization
The Cr content of the thin films was analyzed by electron probe micro analysis (EPMA). X-ray photoelectron spectroscopy (XPS) and Raman spectroscopy were used to investigate the changes in the structural properties of the thin films with the addition of Cr. Field-emission scanning electron microscopy (FE-SEM) was used to measure the thickness of the intermediate and the Cr-DLC layers of the deposited thin films. Electrical conductivity measurements and potentiodynamic polarization tests were carried out to investigate the chemical properties of the thin films. The electrical conductivity of the films was measured using a four-point probe system (CMT-SR1000N). The film deposited on the Si wafer was used as the specimen for this measurement. To evaluate the corrosion resistance of the Cr-DLC thin films, a potentiodynamic polarization test was carried out on a specimen with the Cr-DLC thin film deposited on SUS304. An electrolyte with 2 ppm of hydrogen fluoride (HF) was added to 1 M sulfuric acid (H2SO4) at 80°C to create a high-temperature acidic atmosphere similar to that of polymer fuel cells. Ag/AgCl and Pt were used as the reference and counter electrodes, respectively. From the polarization curves obtained by carrying out the potentiodynamic polarization tests, the corrosion resistance parameters such as the passive current density, passive potential, critical anodic current density, and formal potential of the thin films could be determined.
3. Results and Discussion
3.1. Microstructure of the Cr-DLC films
In order to control the Cr content of the Cr-DLC thin films, the DC power of the Cr target was varied from 0 to 200 W. The cross-sections of the thin films were observed using FE-SEM (Fig. 3). The films showed a multi-layer morphology and had a thickness of approximately 1 μm. The elemental composition of the films was analyzed by EPMA. The changes in the Cr content of the films are shown in Fig. 4, and the elemental compositions of the films are listed in Table 2. As can be observed from Fig. 4 and Table 2, the Cr peak began to appear at the DC power of 100 W. With an increase in power, the Cr content of the films increased from 0 to 29.7 at%. To minimize the Cr content, DC power was used for the deposition. However, because of the high sputtering yield of the equipment used in this study, Cr signals started appearing at 150 W. Therefore, the minimum Cr content obtained by DC power was 14.7 at%.
FE-SEM image of the cross-section of the thin film.
EPMA curves for the Cr-DLC content with varying supplied power.
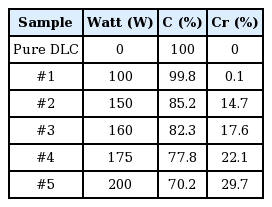
EPMA Results for Carbon and Chromium Contents in Cr-DLC Thin Films
In order to investigate the structural characteristics and degrees of graphitization of the Cr-DLC thin films, Raman analysis was carried out. The G and D peaks of the films were separated by Gaussian curve fitting (Figs. 5 and 6). In graphite-based materials, the G peak is observed at approximately 1580 cm−1. Carbon structures with defects or substituted atoms show a strong D peak at approximately 1350 cm−1.20) DLC thin films are amorphous in nature. These films usually exhibit two peaks: a G peak at approximately 1550 cm−1 (lower than that of graphite) and a D peak at approximately 1350 cm−1.

Comparison of Raman spectral shift with Cr content.

ID/IG position shift with Cr content.
The sp2/sp3 ratio of thin films depends on their ID/IG intensity ratio, which is determined from the Raman analysis. Thus, the crystallinity of thin films can be examined by carrying out their Raman analysis.20,21) The higher the intensity ratio, the higher is the sp2 bond fraction of a thin film and vice versa.1,20–22)
The pure DLC thin films (without Cr) showed a G peak at approximately 1536 cm−1 and a D peak at approximately 1353 cm−1 (Fig. 5). This is typical of thin films deposited by PECVD. However, with an increase in the Cr content, the G peak shifted toward the right. The D peak showed a significant shift at Cr contents > 22.1 at%. The shift in the D peak was caused by the defects or contaminants present in the crystal, and it can be deduced that the Cr content increased in this study. As shown in Fig. 6, the ID/IG value increased gradually with an increase in the Cr content. The ID/IG values of the thin films were inversely proportional to their sp2/sp3 carbon atom ratios. This indicates that the addition of Cr resulted in a reduction in the sp3 bond fraction. With an increase in the Cr content, the sp2 bond fraction of the films increased, while the sp3 bond fraction decreased. In addition, the G peak shifted to higher wavenumbers with an increase in the Cr content.
XPS analysis was carried out to investigate the bonding state between C and Cr in the Cr-DLC thin films. DLC thin films deposited by the PECVD method show XPS peaks at 284.4 (sp2) and 285.2 (sp3) eV corresponding to C-C bonds, 287.7 eV corresponding to C-O bonds, and 288.4 eV corresponding to C=O bonds.23) The XPS results analyzed by Gaussian curve fitting are shown in Figs. 7 and 8 (a, b, and c). Fig. 7(a) shows the XPS spectrum of the pure DLC thin film with peaks at 284.5 (sp2), 285.3 (sp3), and 288.6 ((C=O) bonds) eV. Figs. 7(b) and (C) show the chemical bonds of the films with different Cr contents. These figures show peaks at 284.5 (sp2), 285.3 (sp3), and 288.6 ((C=O) bonds), which are similar to those shown in Fig. 7(a). However, with an increase in the Cr content, the intensity of the C-C (sp2) bond decreased and a peak at 282.8 eV corresponding to the Cr-C bond appeared. This peak was not observed in the case of the pure DLC film. The intensity of the 282.8 eV peak at the Cr content of 29.7 at% was higher than that at the Cr content of 17.6 at%. The peaks corresponding to the C-O and C=O bonds observed in all the specimens can be attributed to the contamination caused by air.

C1s XPS profiles of Cr-DLC thin films of (a) Pure DLC (b) with 17.6 at% of Cr and (c) 29.7 at% of Cr.

Cr 2p XPS profiles of Cr-DLC thin films with (a) 17.6 at% of Cr and (b) 29.7 at% of Cr.
As shown in Fig. 8(a), peaks at 574.2 (Cr-C), 575.3 (Cr-C), 576.9 (Cr-O), 583.7 (Cr7-C3), and 586.2 ((Cr-O) bonds) eV were observed. Fig. 8(b) shows the presence of Cr-C (574.1 and, 574.9 eV), Cr-O (576.15 eV), Cr7-C3 (583.6 eV), and Cr2-O3 (586.54 eV) bonds. From Figs. 8(a) and (b), it can be observed that the peak corresponding to the Cr-C bond (574.2 eV) showed the highest intensity. This is consistent with the C 1s results of the films. Moreover, it can be observed that the intensity of the Cr-C bond peak (574.8 eV) at the Cr content of 29.7 at% was higher than that at the Cr content of 17.6 at%. This confirms that the C-C bond fraction (sp2) decreased with an increase in the Cr-C bond fraction. This is because Cr easily combines with C-C bonds (sp2) to form the Cr-C phase owing to the relatively lower binding energy of sp2 C-C bonds than that of sp3 C-C bonds.23)
3.2. Chemical properties of the Cr-DLC films
The effect of the Cr content on the electrical conductivity of the Cr-DLC thin films was investigated. As shown in Fig. 9, the films showed electrical conductivity at Cr contents of 14.7 at% or more. For the films with Cr contents < 14.7 at%, the electrical conductivity was not measured by the four-point probe system. The electrical conductivity of the film with the Cr content of 17.6 at% was approximately 25 times higher than that of the film with the Cr content of 14.7 at%. Therefore, the electrical conductivity analysis revealed that the Cr-DLC films grown on the Si substrate showed electrical conductivity only at Cr contents higher than 17.6 at%. The corrosion resistance of the Cr-DLC films prepared in this study was compared with that of Ti-DLC films. The Ti-DLC film showed an electrical conductivity of 680 S/cm at the Ti content of 18 at%. Hence, it can be stated that Ti-DLC films show higher electrical conductivity than Cr-DLC films at the same metal loading. This indicates that Ti is more suitable for doping DLC films than Cr.

Electrical conductivity curve with varying Cr content.
Since metals tend to ionize, they decrease the corrosion resistance of DLC films. To mitigate this, it is imperative to develop a novel thin film deposition technique for preparing DLC films with high electrical conductivity and corrosion resistance. Therefore, we investigated the polarization behavior of the Cr-DLC thin films to evaluate their corrosion characteristics. The passive current density, passive potential, critical anodic current density, and formal potential of the Cr-DLC thin films could be determined from their polarization curves. The corrosion resistance of the Cr-DLC films could also be evaluated from their polarization curves. The lower the corrosion potential of a thin film, the higher is its current density and the more is the corrosion. Fig. 10 and Table 3 show the results of the potentiodynamic polarization test. As can be observed, the pure DLC film showed the highest current density and corrosion potential, and hence showed good corrosion resistance. The DLC films with Cr contents of 0.1–17.6 at% showed corrosion resistance similar to that of the pure DLC film. The corrosion resistance decreased gradually when the Cr content exceeded 22.1 at%. The film with the Cr content of 17.6 at% showed a current density of 9.12 × 10⁻² μA/cm2 and a corrosion potential of 0.240 V, which are similar to those of the pure DLC film. The film also showed excellent corrosion resistance and electrical conductivity. The Ti-DLC film showed the highest current density of 2.5 × 10⁻² μA/cm2 and corrosion potential of 0.242 V at the Ti content of 15 at%. Hence, the Cr-DLC films showed better corrosion resistance than the Ti-DLC films.

Potentiodynamic polarization curves of Cr-DLC thin films with varying Cr content.
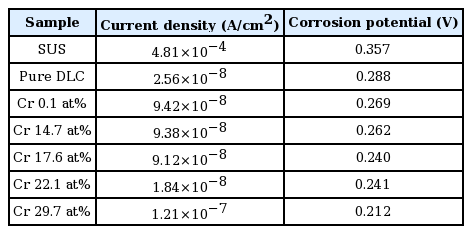
Current Density and Corrosion Potential Values of Cr-DLC Thin Films with Varying Cr Content
3.3. Mechanical properties of the Cr-DLC films
The hardness of the Cr-DLC thin films deposited on the Si-wafer was measured using a nanoindenter (MTS XP, Helmut Fischer). Fig. 11 and Table 4 show the hardness of the Cr-DLC films as a function of the Cr content. The pure DLC film showed a hardness value of 23.6 GPa, which decreased with the addition of Cr. The film with the Cr content of 17.6 at% showed a hardness value of 18.8 GPa. On the other hand, the Ti-DLC film with the Ti content of 18 at% showed a hardness value of 25.6 GPa. This indicates that the Ti-DLC films were harder than the Cr-DLC films. The abrasion test was carried out using a tribometer (Ball-on-disk type, J&L Tech) to investigate the wear characteristics of the Cr-DLC thin films with different Cr contents. The wear characteristics of the films were investigated under both dry and lubrication conditions. GF4 oil was used for lubrication. GF4 oil is a next-generation automotive engine oil for reducing the friction of automotive-driven parts. However, since GF4 oil destroyed the initial DLC film, it was used to examine the damage of the thin films. Therefore, wear tests were carried out using GF4 oil, and the damage of the Cr-DLC thin films was observed after the wear tests. The dry and lubrication wear test conditions are summarized in Tables 5 and 6, respectively. The corresponding test results are shown in Figs. 12 and 13, respectively. The wear test results revealed that under the dry condition, the Cr-DLC thin films showed a friction coefficient of 0.11–0.19, which is comparable to that of the pure DLC thin films (Fig. 12). The DLC films with Cr contents of 14.7 and 17.6 at% showed higher friction coefficients than the pure DLC films (0.11–0.12). The film with the Cr content of 14.7 at% showed the best wear characteristics. This indicates that moderate Cr doping is optimum for developing DLC films with good wear characteristics. The abrasion of the films under the dry condition was investigated using an optical microscope (Fig. 14). Since the lubrication condition yielded low coefficients of friction, it was difficult to observe the abrasion track of the films under this condition. Therefore, wear tracks were observed only under the dry condition. The wear track width of the pure DLC film was about 96 μm, while that of the DLC films with Cr contents of 17.6 and 29.7 at% was found to be about 195 μm. As can be observed from Fig. 14, the surface of the Cr-DLC films easily damaged because of the decrease in their hardness with an increase in the Cr content. Under the lubrication condition, the Cr-DLC films showed friction coefficients of 0.07–0.1, which are similar to those of the pure DLC films (Fig. 13). The coefficient of friction of the films increased slightly with the addition of Cr. In addition, GF4 oil caused no damage to the thin films. In previous studies, Ti-DLC thin films were not damaged by GF4 oil and showed a friction coefficient of 0.2 under dry conditions. The friction coefficients of the Cr-DLC films were about the double of the previously reported Ti-DLC films.
Hardness and elastic modulus with varying Cr content.
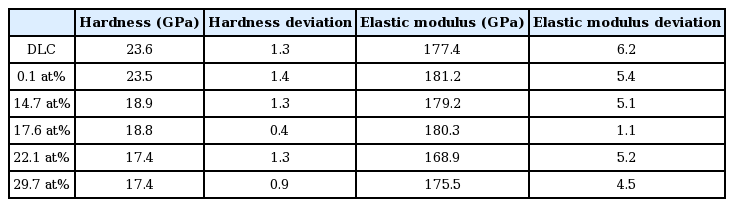
Hardness and Elastic Modulus with Varying Cr Content
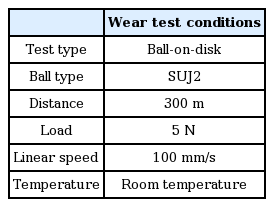
Conditions for Dry Wear Test
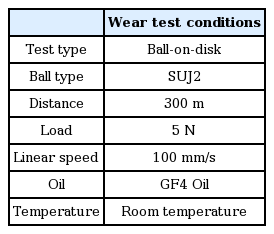
Conditions for Oil Wear Test

Friction coefficient of Cr-DLC thin films with varying Cr content under dry conditions.
Friction coefficient of Cr-DLC thin films with varying Cr content under lubrication conditions.

Optical microscopy images of wear tracks in dry condition for (a) Pure DLC (b) 17.6 at% of Cr and (c) 29.7 at% of Cr.
4. Conclusions
The structural and chemical properties of Cr-DLC thin films deposited using a hybrid method were investigated. The Cr content of 17.6 at% was found to be optimum for achieving good electrical conductivity and corrosion resistance. Under high-temperature acidic conditions, the Cr-DLC thin films showed higher corrosion resistance than the Ti-DLC films at room temperature. In addition, the Cr addition improved the wear characteristics of the DLC thin films by about two times. The Cr-DLC films showed better wear characteristics than the Ti-DLC films. The findings of this study will be useful for developing various automobile parts and separators.
Acknowledgments
This work was supported by the Human Resources Development Program (No. 20174030201830) of the Korea Institute of Energy Technology Evaluation and Planning (KETEP) funded by the Korean Government Ministry of Trade, Industry and Energy, the National Research Foundation of Korea (NRF) funded by the Korean government (Ministry of Education) (No. NRF-2016R1D1A1A02936936), and a grant from the Industrial R&D Program for Core Technology of Materials funded by the Ministry of Trade, Industry, and Energy (10048043, Development of low friction coating components of combustion engine for correspondence of fuel economy regulation), Republic of Korea.