Proton Conduction in Nonstoichiometric ∑3 BaZrO3 (210)[001] Tilt Grain Boundary Using Density Functional Theory
Article information
Abstract
We investigate proton conduction in a nonstoichiometric ∑3 BaZrO3 (210)[001] tilt grain boundary using density functional theory (DFT). We employ the space charge layer (SCL) and structural disorder (SD) models with the introduction of protons and oxygen vacancies into the system. The segregation energies of proton and oxygen vacancy are determined as −0.70 and −0.54 eV, respectively. Based on this data, we obtain a Schottky barrier height of 0.52 V and defect concentrations at 600K, in agreement with the reported experimental values. We calculate the energy barrier for proton migration across the grain boundary core as 0.61 eV, from which we derive proton mobility. We also obtain the proton conductivity from the knowledge of proton concentration and mobility. We find that the calculated conductivity of the nonstoichiometric grain boundary is similar to those of the stoichiometric ones in the literature.
1. Introduction
Iwahara et al. first reported the proton conduction in the perovskite structures such as SrZrO3 and SrCeO3 in 1980, and many following studies have been carried out on the phenomena taking place in the interior of oxides.1–2) Among many proton-conductors, the acceptor-doped barium zirconate (BaZrO3, BZO) has been intensively studied as an electrolyte of protonic ceramic fuel cell (PCFC) because of its high proton conductivity through the grain interior and sound chemical stability.3–12) However, the low proton conductivity across the grain boundary compared to that of grain interior has been recognized as a critical issue.3–13)
The low proton conductivity of BZO grain boundary has been often interpreted with the space charge layer (SCL) model, in which the positively charged protons accumulate in grain boundary.3–13) Another model, the structural disorder (SD) model, has attributed the cause of low proton conductivity to the increased energy barrier for proton transport by the disordered grain boundary.3) Recently, Yang et al. proposed an hybrid model of SCL and SD models, and investigated proton conductivity of a ∑3 BZO (111)[11̄0] grain boundary by using density functional theory (DFT).13)
Studies on SCL formation focused mainly on the stoichiometric BZO grain boundary, and rarely on the nonstoichiometric ones.9–13) Helgee et al., for example, investigated SCL formation for three stoichiometric BZO cases using DFT; ∑3 (110)[11̄0], ∑3 (112)][11̄0], and ∑3 (210)[001] BZO grain boundaries.9) They confirmed that Schottky barrier heights are in the same range of 0.6 V at 600K although the grain boundary structures are different.9) Polfus et al. also investigated the SCL formation on a stoichiometric ∑3 BZO (111)[11̄0] grain boundary using DFT, and reported the height of 0.51 V at 573K.10) These two studies indicate that Schottky barrier heights are not affected much by the orientation of the grain boundaries.
Only limited studies are available for the nonstoichiometric grain boundary structures such as SrTiO3 and BaTiO3.14–15) Kim et al. studied SrTiO3 structure by STEM (scanning transmission electron microscope), and found that the grain boundary is nonstoichiometric.14) Choi et al. measured the Ba/Ti ratio of BaTiO3 by HREM (high resolution electron microscope), and mentioned that the grain boundary compared to the bulk grain has more Ti atoms.15) Recently, Kim et al. evaluated stability of the nonstoichiometric ∑3 BZO (210)[001] grain boundary in terms of oxygen partial pressure and oxygen chemical potential using DFT, and reported that the nonstoichiometric grain boundary is more stable compared to the stoichiometric one.16)
Thus, proton conductivity evaluation at the operation temperature of PCFC with a stable nonstoichiometric BZO grain boundary is important. We design a grain boundary of nonstoichiometric ∑3 BZO (210)[001] for this study by following the SCL model, and calculate the Schottky barrier height and estimate the concentration of proton. We calculate the energy barrier of proton along the minimum transport path, and estimate the proton mobility based on it. We also calculate proton conductivity with proton concentration and its mobility at the grain boundary of the system, and compare it with other reported experimental and theoretical results.
2. Calculation Details
All calculations in this study were carried out within the framework of the DFT using the Vienna Ab-initio Simulation Package (VASP).17–20) Electron wave function was described by the Blöchl’s projector augmented wave (PAW) method formulated by Kresse and Joubert21–22) with the exchange-correlation energy of Perdew-Burke-Ernzerhof (PBE) parameterization within the generalized gradient approximation (GGA).23–24) We considered the strong correlation effect for Zr atom by using Ueff (U - J) of 3 eV proposed by Vladan et al. in their study on the formation energy correction for oxides.25)
We used a cutoff energy of 500 eV, and generated a kpoint grid of 8×8×8 by the Monkhorst-Pack method.26) The orbital occupation by electron at the Fermi level was smeared by the Gaussian method with a smearing factor of 0.05 eV. Electronic and ionic minimizations were carried out until total energy convergence of less than 10−4 and 10−3 eV, respectively. The geometric structure was optimized until each atom’s residual force falls below 0.02 eV/Å. We also analyzed the electronic structure of grain boundary using Bader charge calculation.27) The energy barrier for proton transport was determined by using the climbing image nudged elastic band (CINEB) method.28) All illustrations were drawn by using the Visualization for Electronic and Structural Analysis (VESTA) program.29)
Figure 1(a) shows the perspective view of the optimized BZO unit cell with a lattice constant of 0.428 nm, in agreement with the experimental value of 0.415 nm.30) Fig. 1(b) is the (210) surface of a 2 × 2 × 2 BaZrO3 super cell formed with BaO and ZrO2 planes. Note that Kim et al. formed stoicheometric and nonstoicheometric ∑3 BaZrO3 (210)[001] grain boundaries using the same BaO and ZrO2 planes, and computationally evaluated its stability in terms of temperature, pressure, and chemical potential.16) Fig. 1(c) represents the nonstoicheometric ∑3 BaZrO3 (210)[001] grain boundary, which is found to be the most stable.
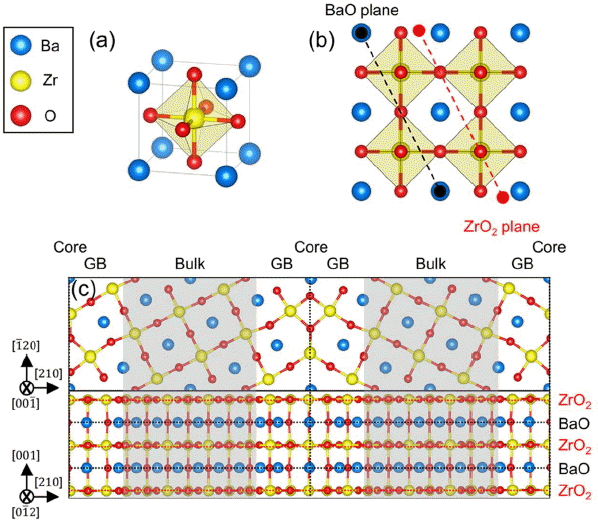
(a) Perspective view of a BaZrO3 unit cell, (b) planar view of a 2 × 2 × 2 BaZrO3 super cell, (c) planar and top views of a nonstoichiometric ∑3 BZO (210)[001] tilt grain boundary. The black and red dashed lines in (b) indicate BaO and ZrO2 planes, respectively.
We introduced the SCL model in order to calculate the electrostatic potential, and concentration (cD, D =H or V) of proton (H) and oxygen vacancy (V) formed in grain boundary. 6–11,31) Dopant concentration of 10% was assumed to be uniformly distributed in the grain boundary structure by following the Mott-Schottky approximation. The partial pressure of water and dielectric constant were set as 0.025 atm and 75, respectively.3,13) The hydration enthalpy and entropy in grain interior were set at −0.79 eV and −0.89 meV/K, respectively.3,13) Mobility of H (μH) was calculated by the following equation.
Here, D0 is the maximum diffusion coefficient, qH is the charge of H, Em is the transport energy barrier of H, kB is the Boltzmann’s constant, and T is temperature. Conductivity of H (σH) is calculated by the following equation using the concentration and mobility of H (cH and μH).
Readers may refer to the paper by Yang et al. for details of SCL model and σH.13)
3. Results and Discussion
Figure 2 shows Bader (Bi, i = Ba, Zr, O) charges of (a) Ba, (b) Zr, and (c) O atom in the nonstoichiometric ∑3 BZO (210)[001] grain boundary along the distance from the grain boundary core (z = 0). The black square, black circle, black triangle, and empty triangle indicate the BBa, BZr, BO in the ZrO2 layer, and BO in the BaO layer, respectively. The vertical dashed line represents the grain boundary core (z = 0), and white and grey regions are grain boundary and grain interior, respectively. In the grain boundary core, BBa became more positive, BO less negative, and BZr less positive compared with their bulk values.
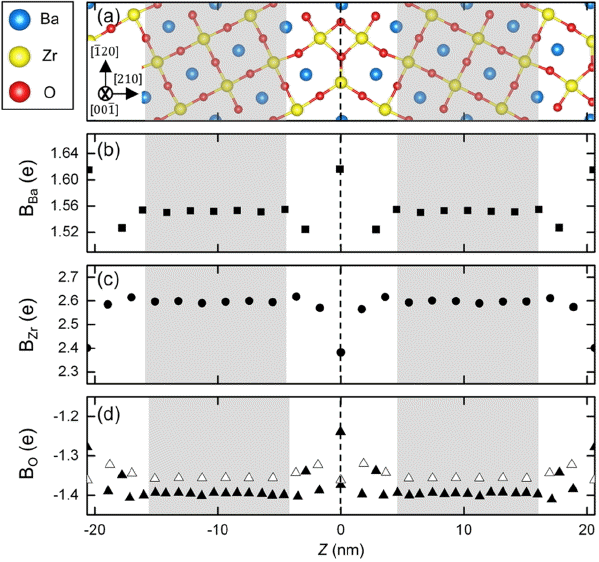
A planar view of (a) the nonstoichiometric ∑3 BZO (210)[001] tilt grain boundary and Bader charges (Bi i= Ba, Zr, and O) of (b) Ba, (c) Zr, (d) O atoms as a function of Z. The black square, black circle, black triangle, and empty triangle correspond to the BBa, BZr, BO at ZrO2 layer, and BO at BaO layer respectively. The vertical dashed line indicates grain boundary core (Z = 0).
Since O atoms coordinate with two and three Zr atoms in grain interior and grain boundary, respectively, the O atoms in grain boundary are positively charged compared to the other case. Charges of BBa and BZr in grain interior converged to 1.55 and 2.60 e, respectively. BO in the BaO and ZrO2 layers converged to 1.35 and 1.40 e, respectively. This may attribute to the difference in atomic arrangement in the BaO and ZrO2 layers. We also confirmed that BBa and BZr are symmetric along the base line of Z = 0, but BO is slightly asymmetric.
Figure 3 shows the ∑3 BZO (210)[001] grain boundary, and changes of H and V formation energy (ED, D = H or V) along the distance from Z = 0. We calculated ED by the following equation.
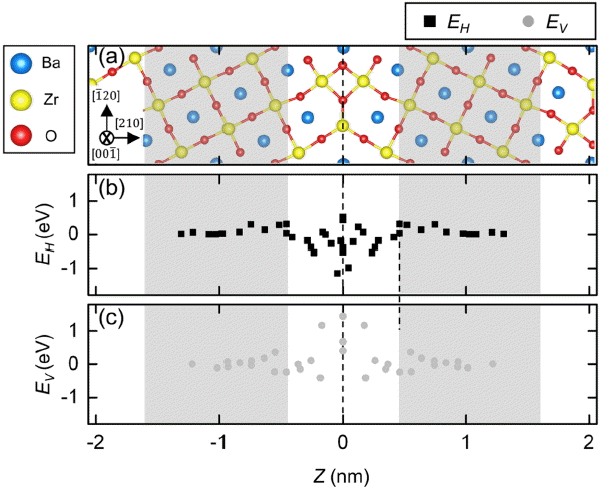
A planar view of (a) the nonstoichiometric ∑3 BZO (210)[001] tilt grain boundary, and defect formation energy (E) as a function of the (b) proton and (c) oxygen vacancy position from the grain boundary core (z).
Here,
O atoms coordinated with three Zr atoms have positive charges compared to O atoms in the grain interior, which leads to the formation of H or V and likely makes the grain boundary rather unstable. EH in the grain boundary core is in the range of −1.16 ~ 0.58 eV, which is indicative of a stable segregation of H to the grain boundary. Note also that EH in the grain boundary region is asymmetric, which may be due to the changed BO from structural variation. V also could stably segregate to the grain boundary region, and its EV is in the range of −0.6 ~ 0.6 eV.
Yang et al. considered the multi-H (multi-proton) effect to calculate the segregation energy (EH,seg) more precisely. They averaged EH for the excessively-segregated H adjacent to the grain boundary core.13) Under the hydration condition, however, there is no need to consider the multi-V effect, since its concentration is very low in the core.9–13,16) We further clarified that H can segregate easier to the grain boundary compared to V, since EH,seg (−0.70 eV) is lower than EV,seg (−0.54 eV).
Figure 4(a) shows the change of the electrostatic potential, ϕ(z), as a function of z at 600K. Dark yellow, light yellow, and grey zones indicate GBC, SCL, and B, respectively. As a consequence of the segregated H to the grain boundary region, a Schottky barrier height (Δϕ(0)) as calculated by the following equation appeared in the grain boundary core.
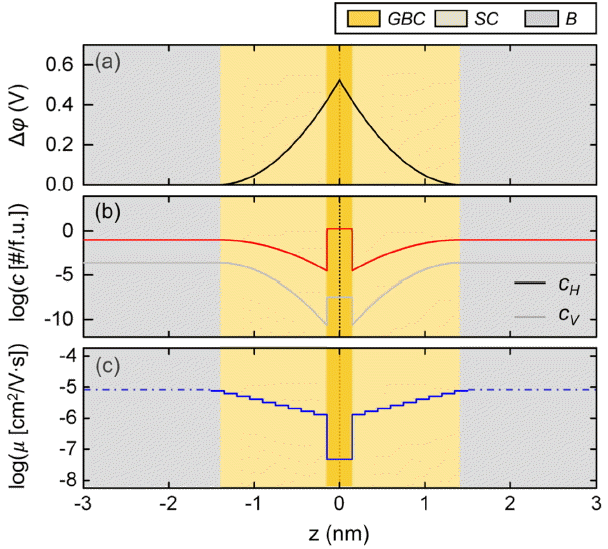
(a) Δϕ, (b) cH and cV, and (c) the proton mobility as a function of z at 600 K, where dark yellow, light yellow, and grey zones are GBC, SCL, and B, respectively.
Here, ϕ(0) and ϕ(∞) are electrostatic potentials in the grain boundary core and far away from it, respectively. We obtained Δϕ(0) of 0.52 V and SCL thickness (λ) of 1.46 nm at 600K. We found that these are very close to the values of 0.51 V and 1.41 nm, respectively, reported by Yang et al.13)
Figure 4(b) shows change of cH and cV (represented by red and grey lines, respectively) as a function of z at 600K. cH is high at the GBC, but cV with the same positive charge is very low. In the SCL region right next to the GBC of 0.3 nm, concentrations of cH and cV become very low, and increase gradually toward the B region.
Figure 4(c) shows change of H mobility (
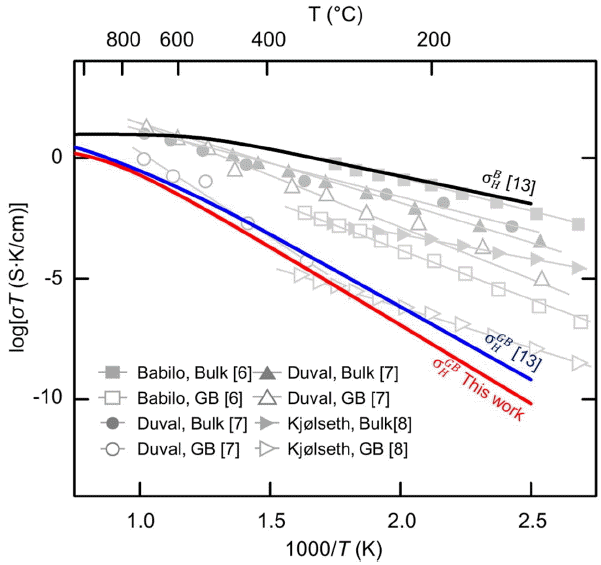
Figure 5 shows change of proton conductivity as σT against reciprocal temperature (1000/T) based on the calculated cH and by using the SCL and SD models. The black, blue, and red lines represent
4. Conclusions
We evaluate proton conduction for the nonstoichiometric ∑3 BaZrO3 (210)[001] tilt grain boundary using DFT. We introduce H and V into the grain boundary to calculate cH and cV using SCL model, and observe positional changes of energy. We confirm that both H and V prefer to segregate to the grain boundary core to be more stable with EH,seg and EV,seg of −0.70 and −0.54 eV, respectively. The barrier energy for H crossing the grain boundary core is 0.61 eV by the SD model, which leads to calculation of μH. We conclude that stoichiometry has only minor effects on
Acknowledgments
This study is supported by the Fusion Research Program for Green Technologies through the National Research Foundation (NRF) of Korea funded by the Ministry of Education, Science and Technology (2011-0019304), and by the KIST Institutional Program (Project No. 2E24021).
