


1. Introduction
Silicon carbide (SiC) is a promising alternative to silicon (Si) as substrates for high-performance power electronic devices. Various methods such as physical vapor transport, 1,2) high-temperature chemical vapor deposition,3,4) and top-seeded solution growth (TSSG)5-7) are used for growing SiC single crystals. Among these, the TSSG method is widely used to fabricate high-quality SiC single crystals with low dislocation density.8) In the TSSG method, crystals are grown on SiC seed crystals placed on molten Si. This is similar to the Czochralski method for growing Si crystals. However, unlike the Czochralski method, the TSSG method does not use pure Si liquid. In the TSSG metthod, a C-dissolved Si solution, in which C is supplied by the dissolution of the graphite crucible, is used.
Therefore, the SiC crystal growth via the TSSG method is very challenging as compared to that via the Czochralski method. The TSSG reactor is closely sealed with a thermal insulator during the crystal growth, which makes it difficult to determine the process control parameters. Hence, the process modeling of the TSSG method is essential to control the reactor precisely and to understand the behavior of the matter under a certain process condition. In order to investigate the growth rate and quality of SiC crystals grown via the TSSG method, Ha et al. proposed an approach to control the temperature gradient in the melt and investigated the effect of temperature gradient especially near the melt-crystal interface.9) Though the reports on the effect of the aperture of the hot-zone on the growth of SiC crystals via the TSSG method are scarce, we believe that the control of the aperture on the hot-zone can provide a precise control of the temperature gradient in the reactor to obtain high-quality SiC with a reasonable growth rate. Hence, in order to determine the optimal temperature ggradient for balancing the growth rate and crystal quality, we further investigated (both theoretically and experimentally) the temperature gradient in the reactor by changing the aperture of the hotzone.
2. Modeling and Experimental
2.1. Modeling description
To investigate the temperature profile, mass transport, and fluid flow in the TSSG reactor, finite element analysis simulations based on electromagnetic and mass and heat transfer analyses were carried out using COMSOL Multiphysics package.10) The hot-zone structure of the TSSG reactor with a short insulator, which was used to investigate the effect of the length of the graphite insulator in our previous study,9) was chosen as the reference model in this study. The hot-zone model is shown in Fig. 1. Compared to our previous model,10) a heat shield made up of graphite was additionally attached to the seed shaft to adjust the aperture of the hot-zone in the TSSG reactor. The hot-zone aperture is the distance d between the heat shield and the top of the insulator. The physical theory and calculation details are described elsewhere.7,9,11,12) All the materials used in the simulation are shown in Fig. 1, and their properties are listed in Table 1.
The domain was meshed mainly by triangular elements. The maximum size of the triangular meshed elements was set to 50 mm in the global domains. The domain corresponding to the silicon melt near the crystal surface was meshed with quadrangle elements. As shown in Fig. 1, in the melt region close to the seed crystals, finer elements with the smallest element-size of about 25 μm were used to improve the calculation accuracy. High-temperature heat transfer is strongly governed by thermal radiation. Thus, temperaturedependent thermal radiations were assigned on the surfaces in the hot-zone. Since, the coil and chamber wall were cooled by water in the real system, their temperatures were fixed at 25°C.
2.2. Experimental procedure
SiC crystals were grown via the TSSG method using the hot-zone structure shown in Fig. 1. The distance d was varied from 20 to 30 and 40 mm. Semiconductor grade Si chunks (9N-OCI, Korea) were used as the silicon source. Si (79 g) was placed in a graphite crucible with an inner diameter of 50 mm. The melt height was about 17 mm. On-axis 4H-SiC crystals with a diameter of 10 mm were used as the seed crystals. The working pressure was set at 715 Torr under Ar atmosphere. The reactor was heated via induction heating (at a frequency of approximately 8.5 kHz). The temperatures at the melt surface and beneath the bottom of the crucible were measured using pyrometers (IR-CA, Chino, Japan). SiC crystals were grown on the Si-face of the seed SiC crystals for 4 h at 1900°C. The rotation rate during the crystal growth was 30 rpm. After the crystal growth, the grown crystals were separated from the graphite shaft and etched to remove the residual Si droplet using a HF-HNO3 solution. The etched crystals were then characterized using optical microscopy (ME600L, Nikon, Japan), high-resolution X-ray diffraction (HRXRD, Smartlab, Rigaku, Japan), atomic force microscopy, and micro-Raman spectroscopy (Alpha300, WITec, Germany).
3. Results and Discussion
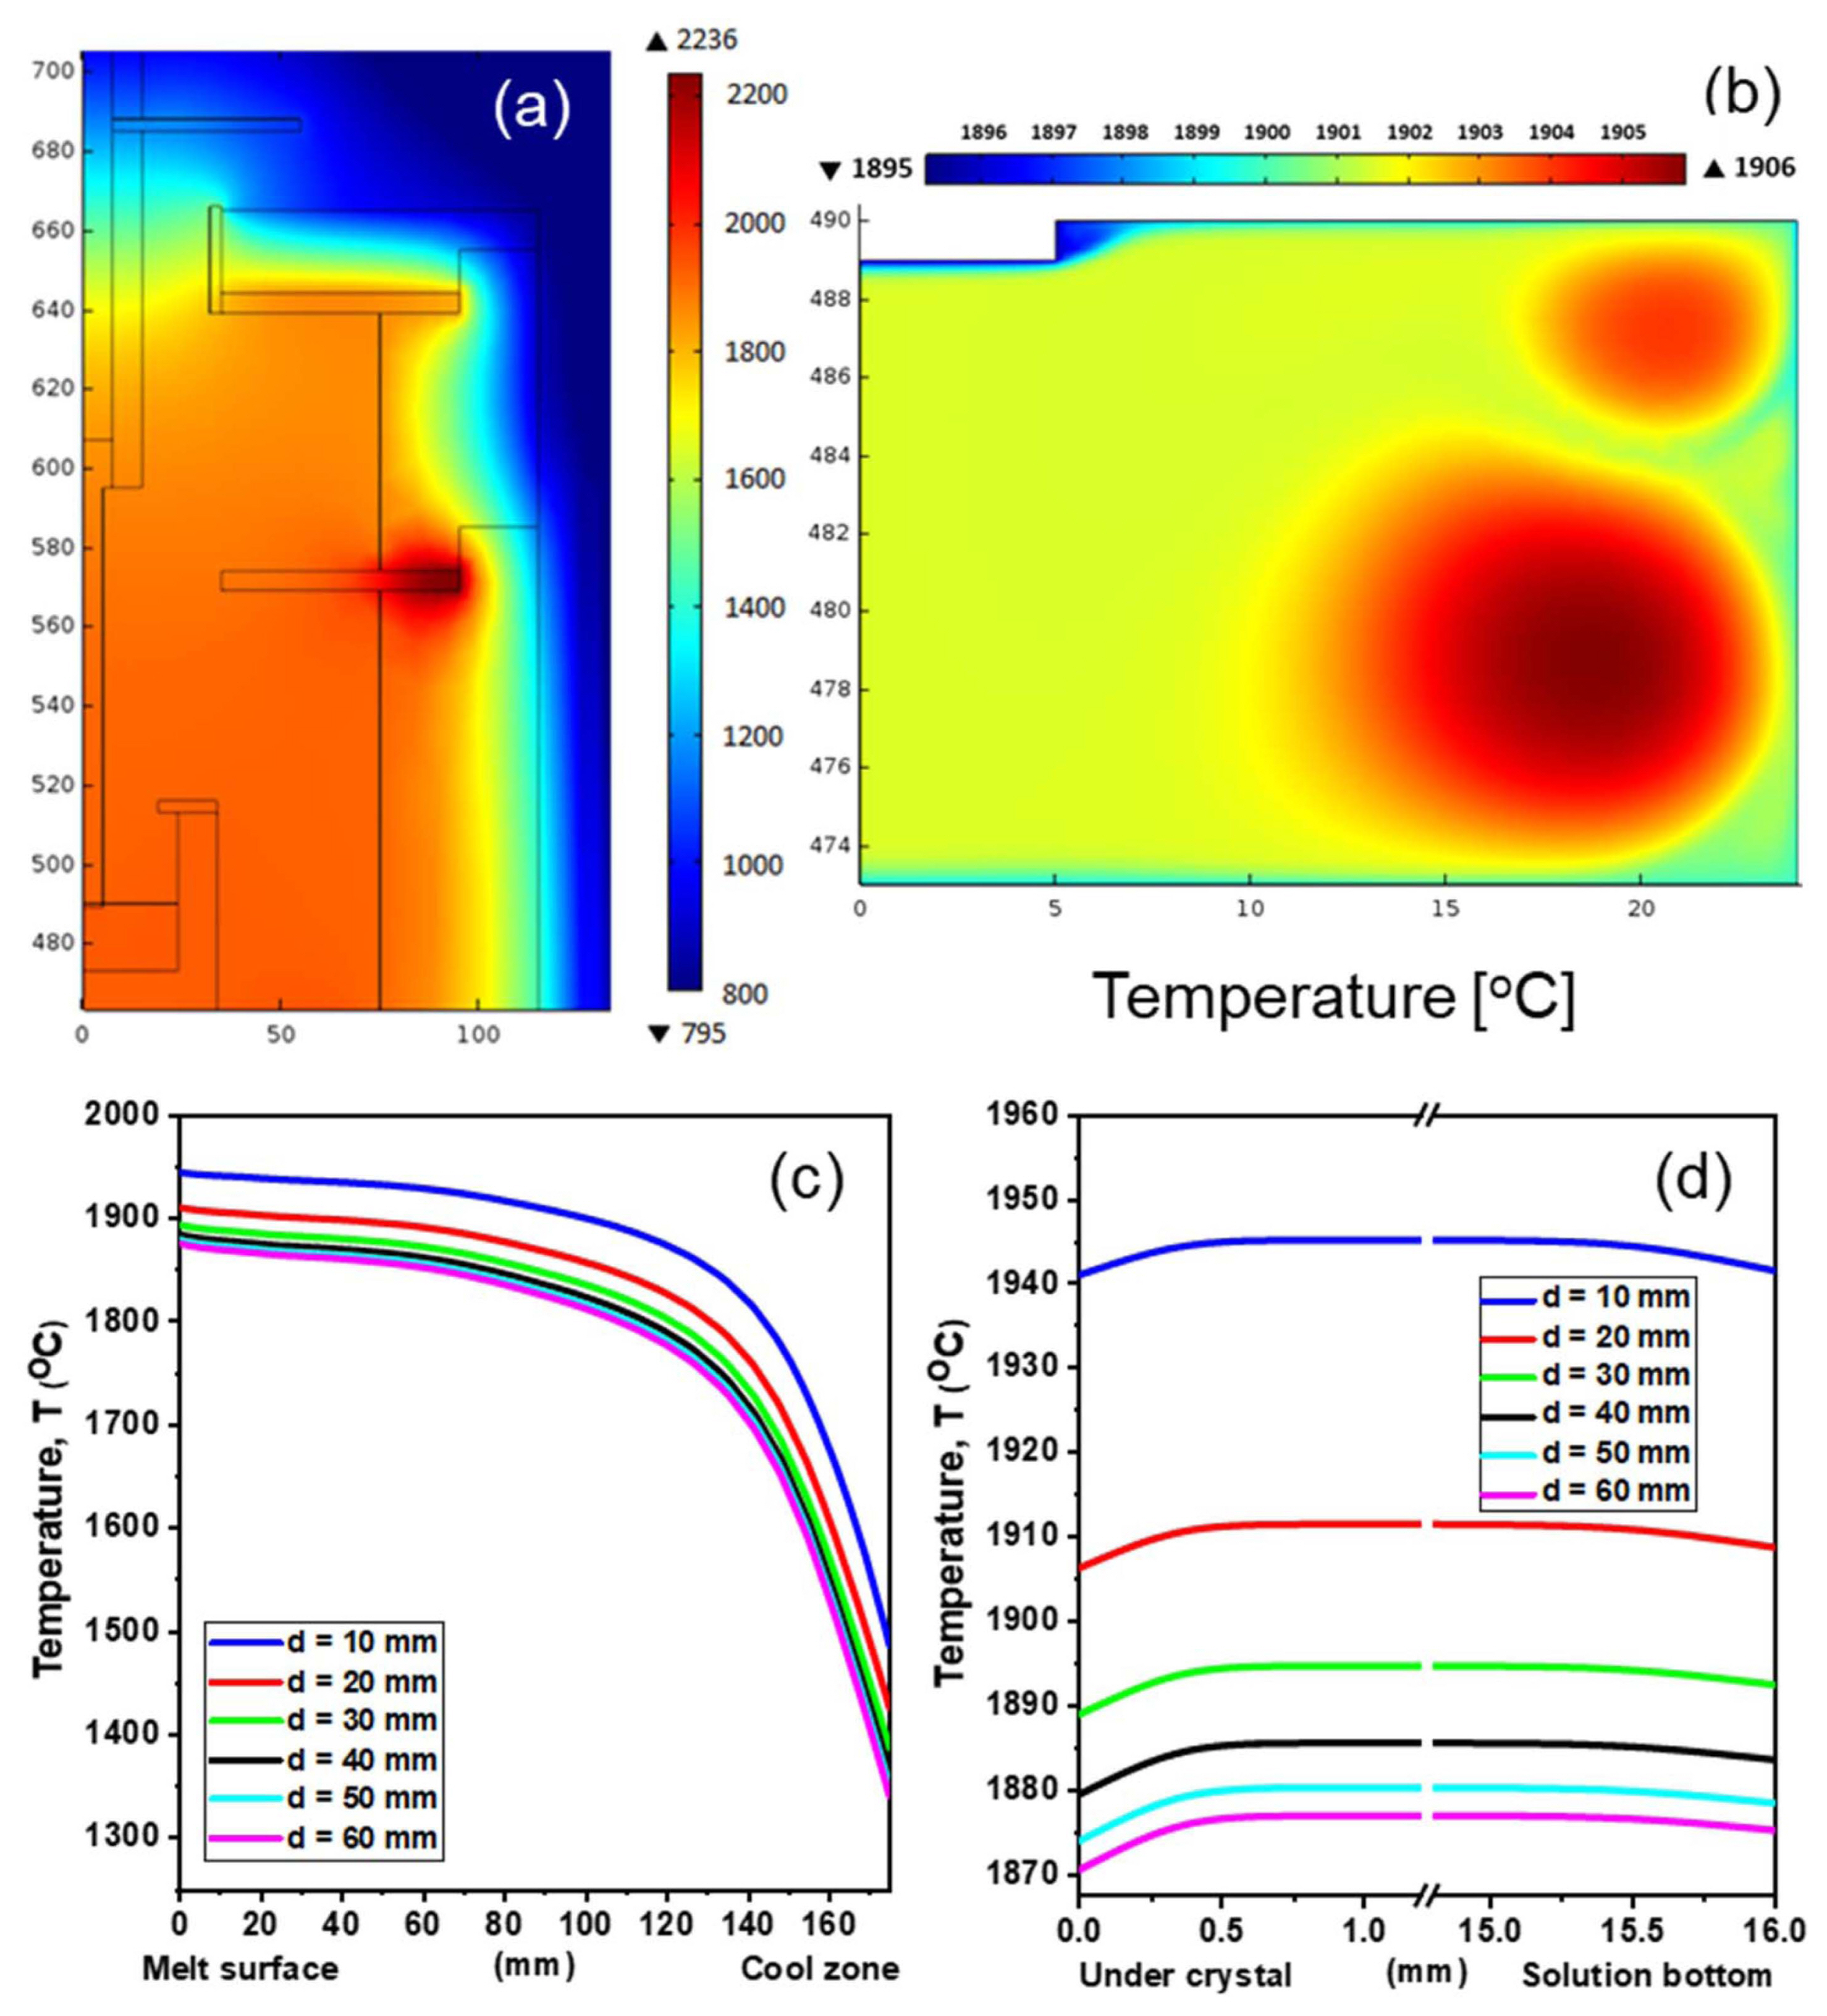
As shown in Fig. 2(a), the temperatures inside and outside the graphite insulators were significanlty different. Temperature diffused along the aperture at the top of the hotzone, indicating that most of the heat loss occured through the aperture. To investigate the effect of the aperture size on the growth behavior of the SiC crystals, the temperature distribution along the axisymmetric line from the bottom to top of the reactor was plotted as a function of the distance d (from 10 mm to 60 mm) at a fixed input power. As can be observed from Figs. 2(c) and 2(d), the overall temperature of the vapor and melt inside the hot-zone decreased with an increase in d. These results suggest that thermal convection can be limited by adjusting the aperture to a value close to that of perfect closed systems.
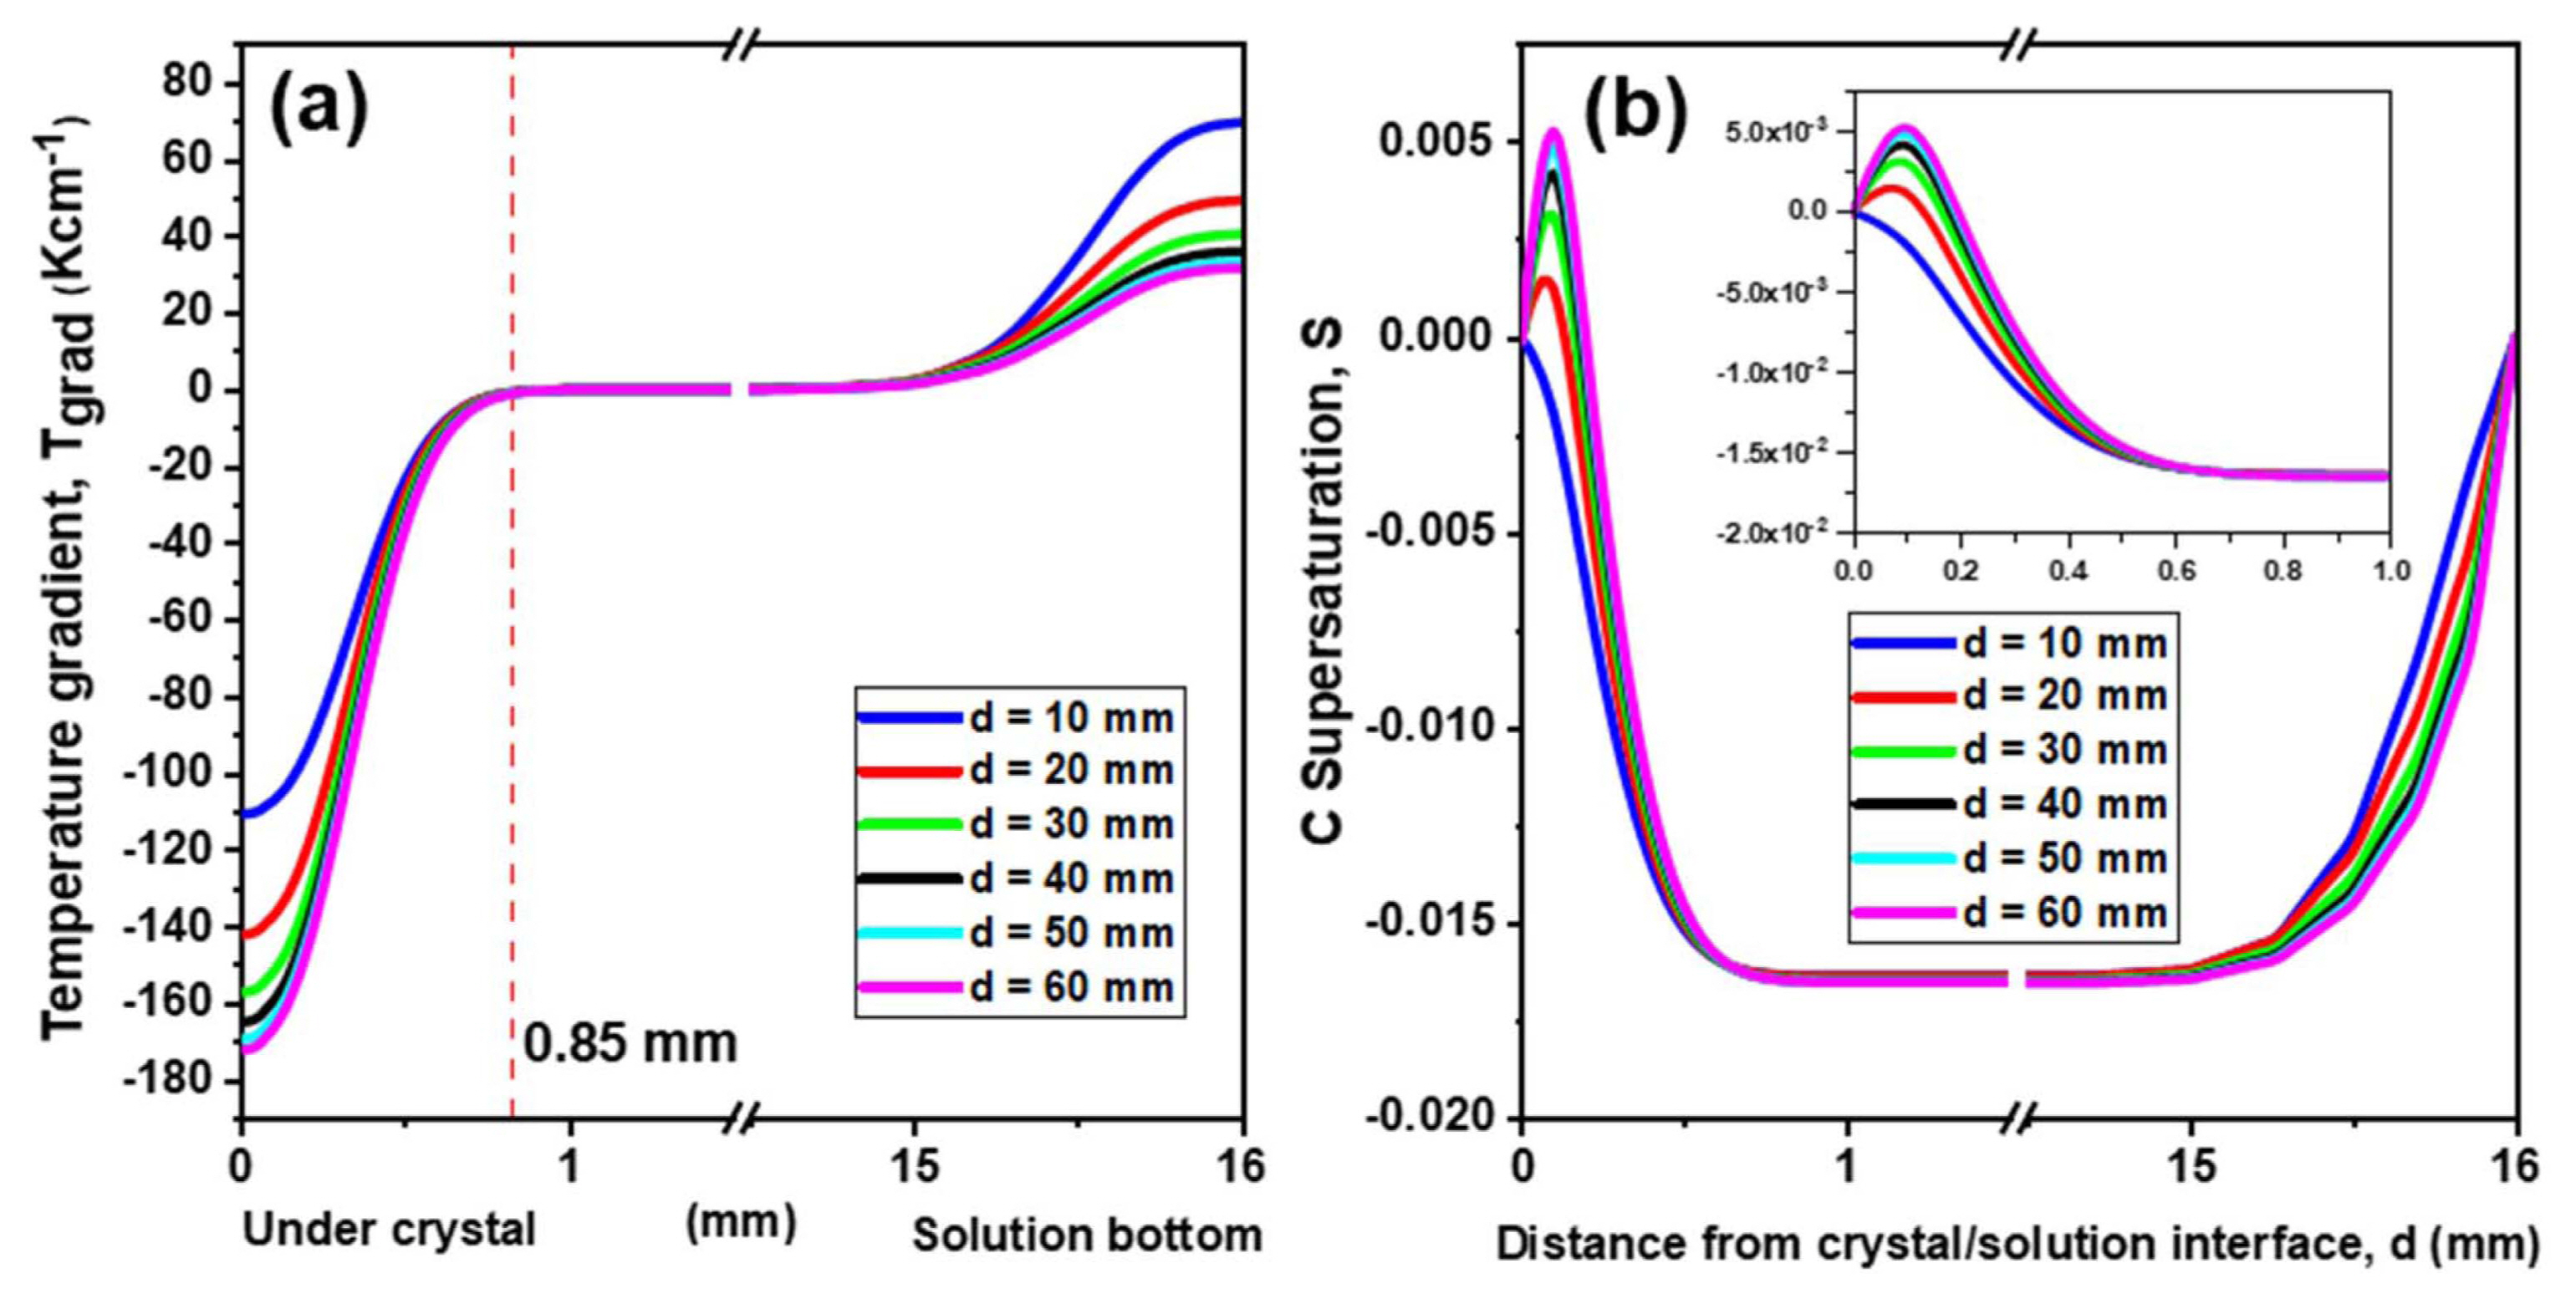
As can be observed from Fig. 3(a), C was uniformly distributed in the melt because the temperature of the melt was quite uniform. However, C concentration boundary layers with large C concentration gradients were observed near the crystal surface and crucible wall. The thickness of the C concentration boundary layers was less than 0.2 mm, as shown in Fig. 3(b). The C concentration gradient near the crucible-melt can be attributed to the dissolution of C from the crucible in the melt, as reported by Kim et al..13) On the other hand, the C concentration gradient near the meltcrystal interface can be attributed to the consumption of C for the growth of the SiC crystals, as reported by Ha et al.7) The temperature gradient in the melt (Fig. 4(a)) was similar to the C concentration gradient except the broader temperature boundary layer near the melt surface and crucible wall. The thickness of the temperature boundary layer near the crystal was about 0.85 mm, which is about four times higher than that of the C concentration boundary layer. It should be noted that the temperature gradient near the melt-crystal interface could be controlled within the range of tens K/cm (from - 110 to - 170 K/cm) by changing d from 10 to 60 mm. Hence, the adjustment of the aperture at the top of the hot-zone was found to be an efficient aperture to control the reactor temperature. Considering the long-term growth, this technique can be very useful for controlling the temperature profile and growth rate of SiC crystals.
The C supersaturation of the crystals, which is a function of temperature (T) and the C concentration (C) distribution: S = C/Cs − 1, where the C solubility Cs = f(T), is plotted in Fig. 4(b). Except for the value at d = 10, all the C saturation values were positive near the crystal, and the local maxima were observed at ~ 0.1 mm. These local maxima indicate that C was consumed during the crystal growth.9) However, the negative C supersaturation value at d = 10 mm indicate the occurrence of melt-back from the SiC crystal to the melt. Fig. 4(b) suggests that the case of d = 10 mm was not favorable for the growth of the SiC crystals. Configurations with d > 40 mm were also excluded because the temperature and C supersaturation distribution in these case were not remarkably different from those in the case with d = 40 mm. This is the reason why only the three cases of d = 20, 30, and 40 mm were used experimentally.
The SiC crystals grown with d = 20, 30, and 30 mm, were labeled as D20, D30, and D40, respectively. As can be observed from Fig. 5(a), the Raman spectra of these samples showed two folded transverse optical (FTO) peaks at ~ 774 and ~ 796 cm−1 and one folded longitudinal optical (FLO) peak at ~ 962 cm−1. The Raman spectroscopy results showed that the grown crystals were 4H-SiC. Fig. 5(b) shows the full width at half maximum (FWHM) of the HRXRD rocking curves for D20, D30, and D40. The FWHM value decreased significantly with a decrease in d. This indicates that the quality of the grown SiC crystals was inversely proportional to the temperature gradient, which depended on d.
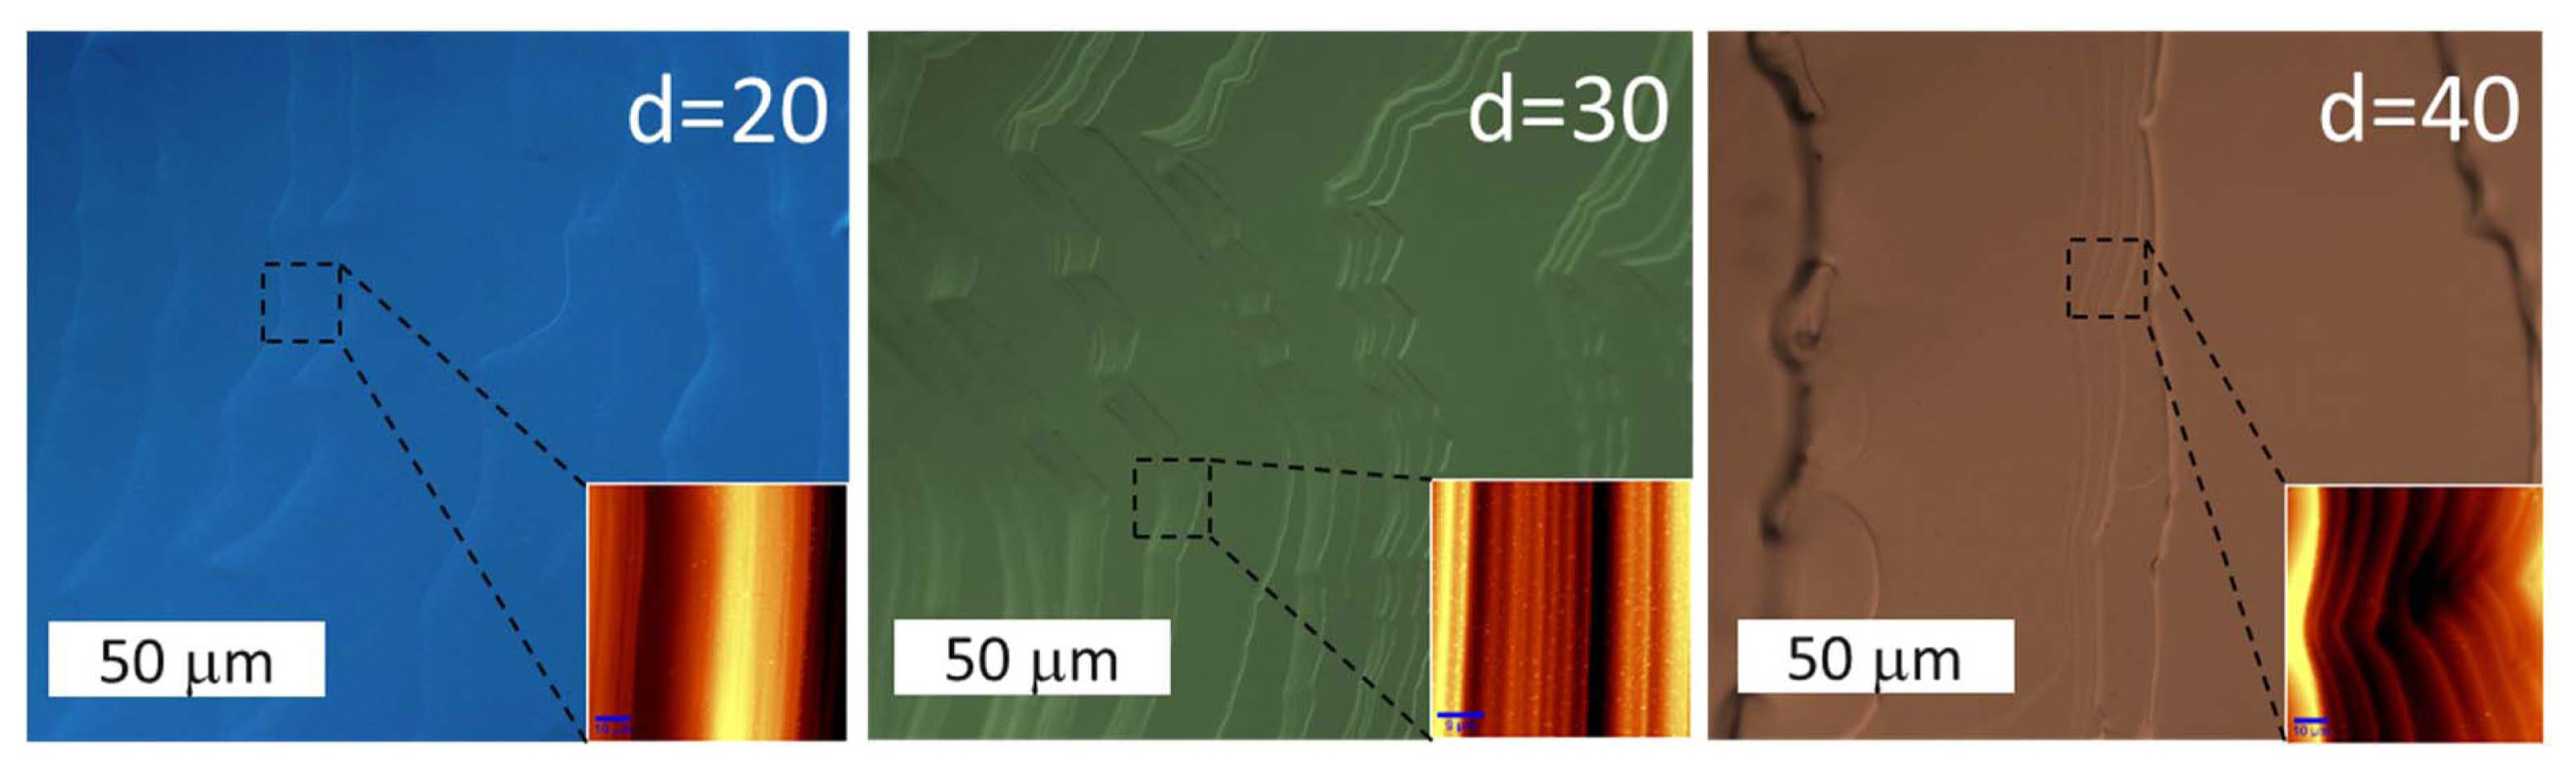
As can be observed from Fig. 6, the terrace width and number of micro-steps increased with an increase in d. However, the step height decreased with an increase in d. The terrace widths for D40, D30, and D20 were ~ 90, ~ 40, and ~ 25 μm, respectively. Two-dimensional nucleation occurred easily at large terraces and could be the origin of polytypes. Hence, small apertures are suitable for the growth of high-quality crystals. The AFM scanning images shown in Fig. 6 confirm the step-size of the grown crystals. The average step-sizes of D40, D30, and D20 were 7.6, 2.4, and 1.6 μm, respectively. While deep micro-steps are the origin for trenches and metal inclusions, small steps indicate good growth conditions for crystals with a smooth surface without polycrystals and inclusions.
The Raman spectroscopy results showed that the D40 sample showed some polytype inclusions (Fig. 7). Hence, the aperture sizes of 20 ≤ d ≥ 30 were found to be suitable for the growth SiC crystals without polytype inclusions using the TSSG method.
4. Conclusions
In this study, the effects of the aperture at the top of the hot-zone on the temperature gradient in the hot-zone and the crystal growth of SiC crystals obtained using the TSSG method were investigated. The simulation results (temperature, C concentration, and supersaturation in the melt) were used for carrying out the experiments. The experimental results revealed that small temperature gradients near the crystal were suitable for the gowth of the SiC crystals via the TSSG method. Finally, the adjustment of the aperture of the hot-zone was demonstrated to be an efficient method to finely control the temperature gradient in the melt (at the scale of tens of K/cm).