1. Introduction
The use of fossil fuels has increased every decade since the start of the industrial revolution, and the emissions of greenhouse gases have also been rapidly rising. Currently, fossil fuels account for about 80% of global energy sources and will be used as important energy resources in the future as well. Thermal power generation, iron manufacturing, steel manufacturing, and cement production are representative industries that consume a huge amount of fossil fuels and emit a large amount of greenhouse gases. Greenhouse gases include carbon dioxide, methane, nitrous oxide, perfluorocarbon, hydrofluorocarbon, and sulphur hexafluoride; carbon dioxide accounts for the largest part. Recently, industries consuming a large amount of fossil fuels have begun paying increasing interest in methods of treating and recycling industrial byproducts, and various studies have been actively carried out to reduce carbon dioxide emissions, including the carbonation of industrial byproducts and minerals.1,2)
Mineral carbonation is a technology for converting certain minerals into stable carbonate minerals by reaction with CO2.3,4) Mineral carbonation was firstly introduced in 1990 by Seifritzas the concept of “CO2 binding.” Since then, many researchers have investigated mineral carbonation using the direct method and the indirect method described by Seifritz. The direct method refers to mineral carbonization occurring in a single process, while the indirect method includes the preliminary extraction of Ca or Mg from minerals followed by carbonization. The direct method is the simplest mineral carbonization method. The direct gas-solid carbonization reaction is a direct method for carbonizing pulverized metal oxides under specific temperature and pressure conditions through contact with gas phase CO2. However, almost no studies have been conducted on this method, due to its extremely slow carbonization reaction rate. The aqueous direct carbonization method is performed by injecting CO2 into an aqueous solution, and achieves a high carbonization ratio and a high reaction rate.
To remove sulfur compounds, the boiler combustion processes used at power plants include desulfurization facilities, which are classified as dry facilities and wet facilities.5) The wet desulfurization facilities produce dihydrate desulfurized gypsum (CaSO4·2H2O), which is used for the manufacturing of plaster boards and cement setting retarders.5,6) Dry desulfurized gypsum generated from dry desulfurization facilities consists of CaO and CaSO4 crystals. Dry desulfurized gypsum is used in the manufacturing of solidifying agents and swelling agents, but some is reclaimed.
The CaO crystal included in dry desulfurized gypsum may be used as a base mineral for the absorption of and reaction with CO2. Therefore, the present study was conducted to investigate and analyze the CO2 absorption and reaction characteristics of dry desulfurized gypsum.
2. Experimental Procedure
Among the carbonization methods mentioned above, the direct aqueous carbonization method was employed for the carbonization of dry desulfurized gypsum. The carbonized mineral was dry desulfurized gypsum (H Company, South Korea), and the CO2 gas was of a reagent grade (purity: 99.9%). The content of dry desulfurized gypsum and mixing water was controlled to prepare a slurry, and distilled water was used as the mixing water. The slurries were prepared by fixing the weight ratios of dry desulfurized gypsum to mixing water to 1 : 2 and 1 : 3. Then, the resulting slurries were carbonized while stirring the slurries on a carbonization tester for 24 h, as shown in Fig. 1.
The carbonization chamber (cc600, Woojin Fine Chemical) was kept at an internal temperature of 20°C and a relative humidity of 30%. The CO2 concentration was kept at 20%, and the slurries were stirred at a constant stirring rate 550 rpm using a stirrer (MSH-20D, Daehan Science). Then, the slurries were sampled at different carbonization times to analyze the change in crystals, microstructures, and degree of carbonization. The slurry samples were dried in a drying apparatus at 50°C to a constant weight for analysis. The change in the crystals inside the dried samples was analyzed by X-ray diffraction (XRD), and the microstructure was analyzed by scanning electron microscope (SEM). The degree of carbonization was quantitatively analyzed by thermogravimetry differential thermal analysis (TG-DTA).
3. Results and Discussion
3.1. Analysis of chemical compositions and microstructure of dry desulfurized gypsum
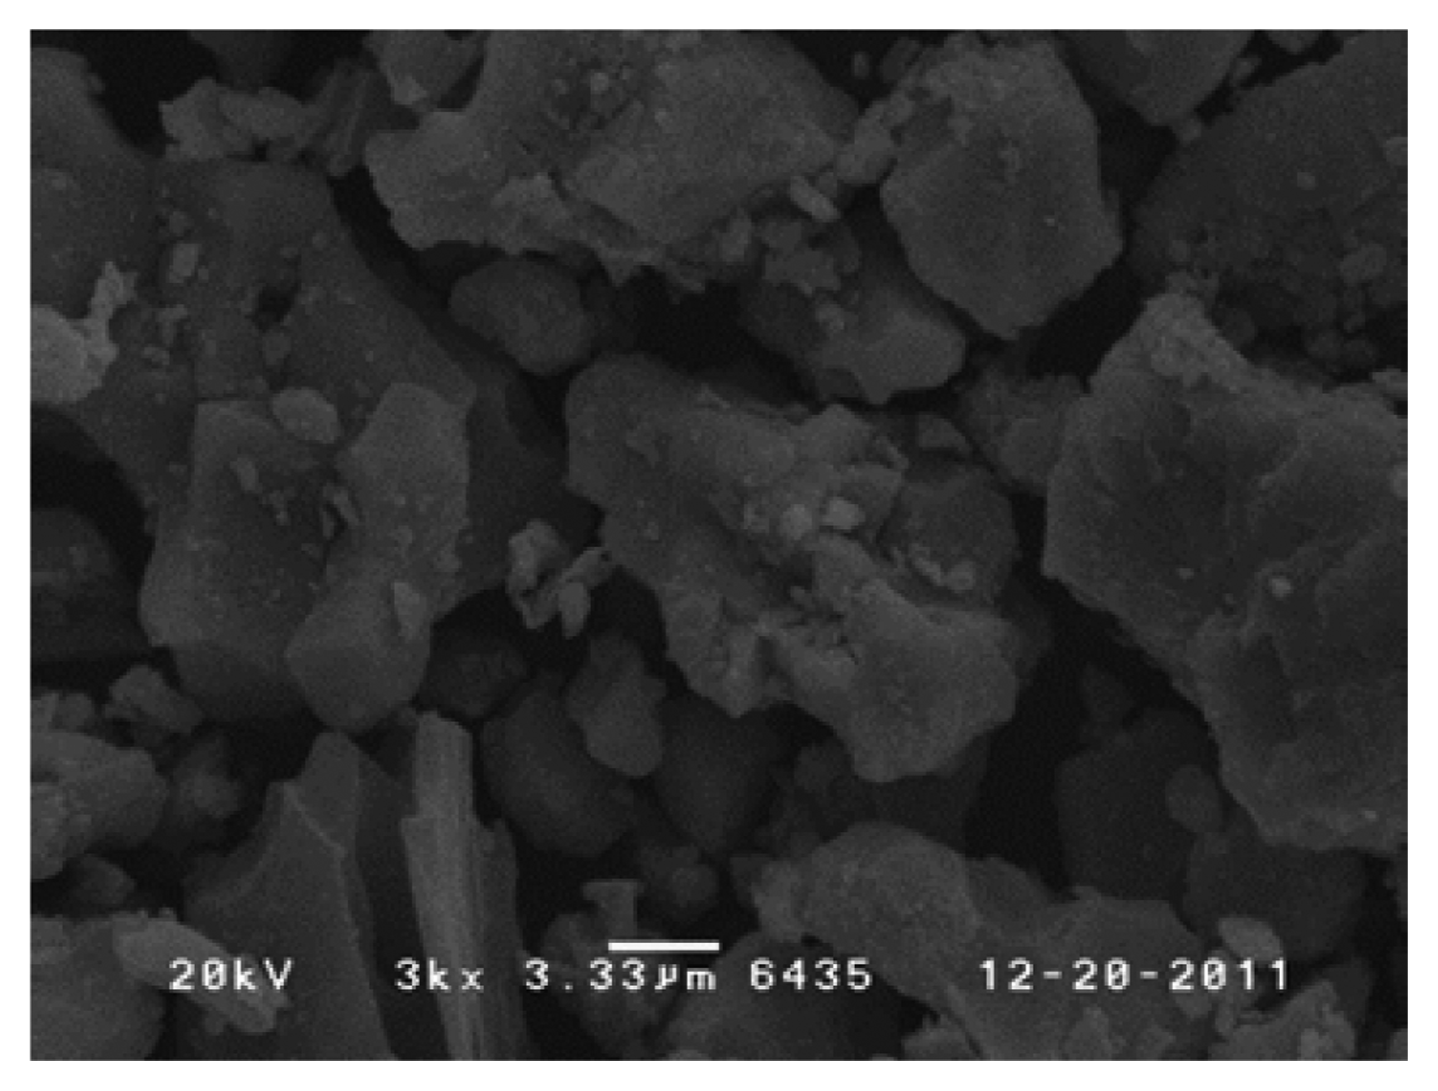
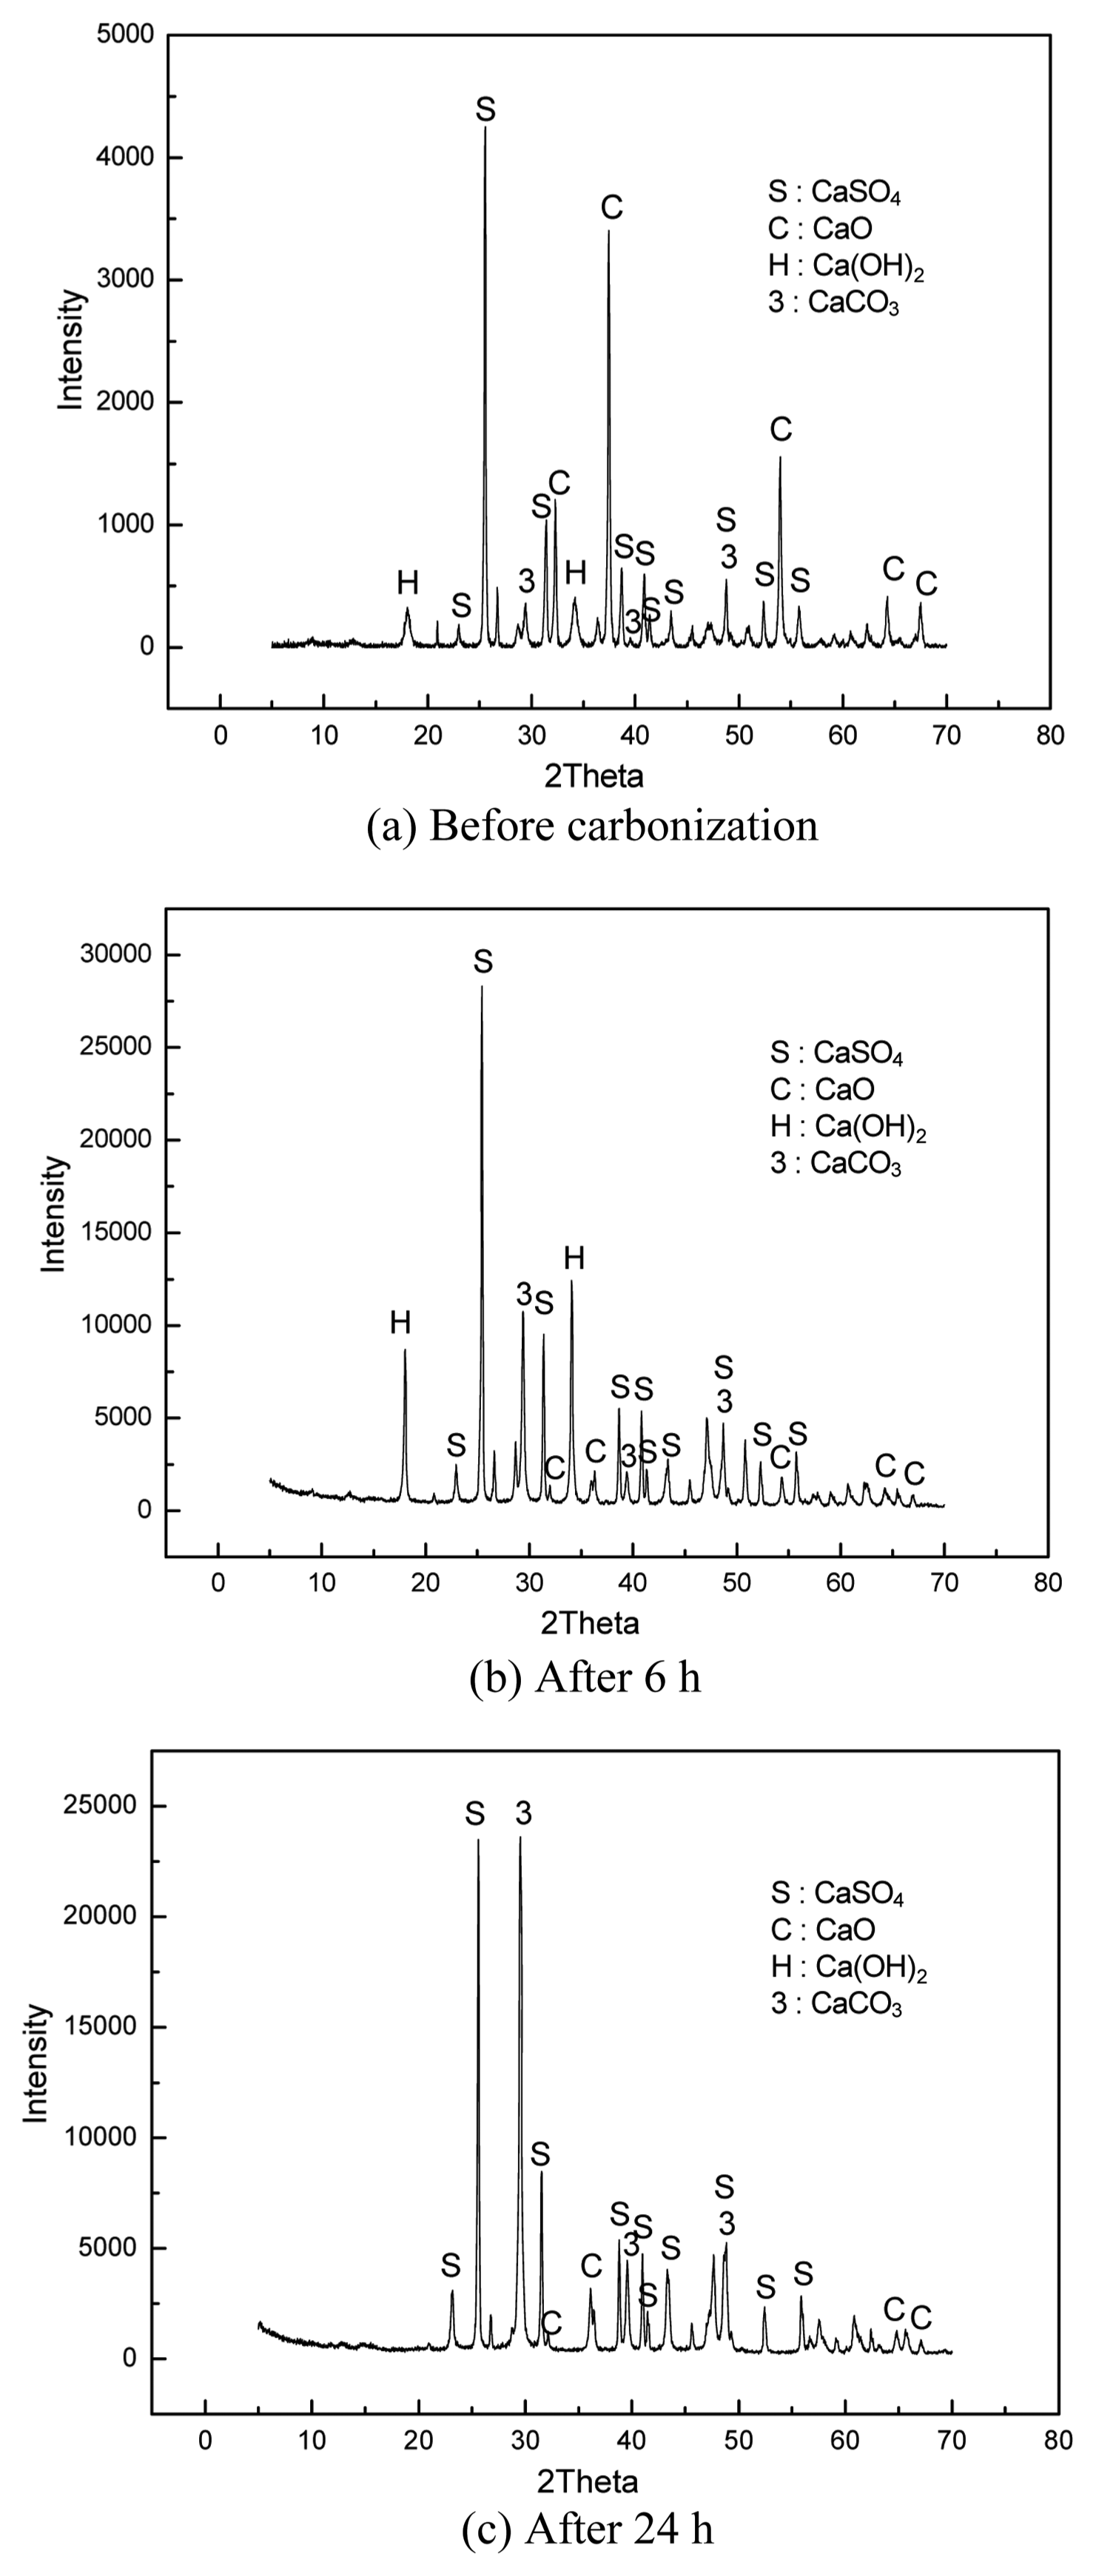
Table 1 shows the chemical compositions of the dry desulfurized gypsum produced by H Company (South Korea). The major components of the gypsum were CaO (53.40%) and SO3 (31.31%). The XRD pattern in Fig. 2 shows that the major crystalline components of the dry desulfurized gypsum were CaO and CaSO4, and Ca(OH)2 hydrates produced by the reaction of CaO with the water in the air were also found. Fig. 3 is an SEM image showing the microstructure of dry desulfurized gypsum, indicating that the dry desulfurized gypsum did not have a specific microstructure. The mean particle diameter was about 20 μm.
3.2. Carbonization of dry desulfurized gypsum
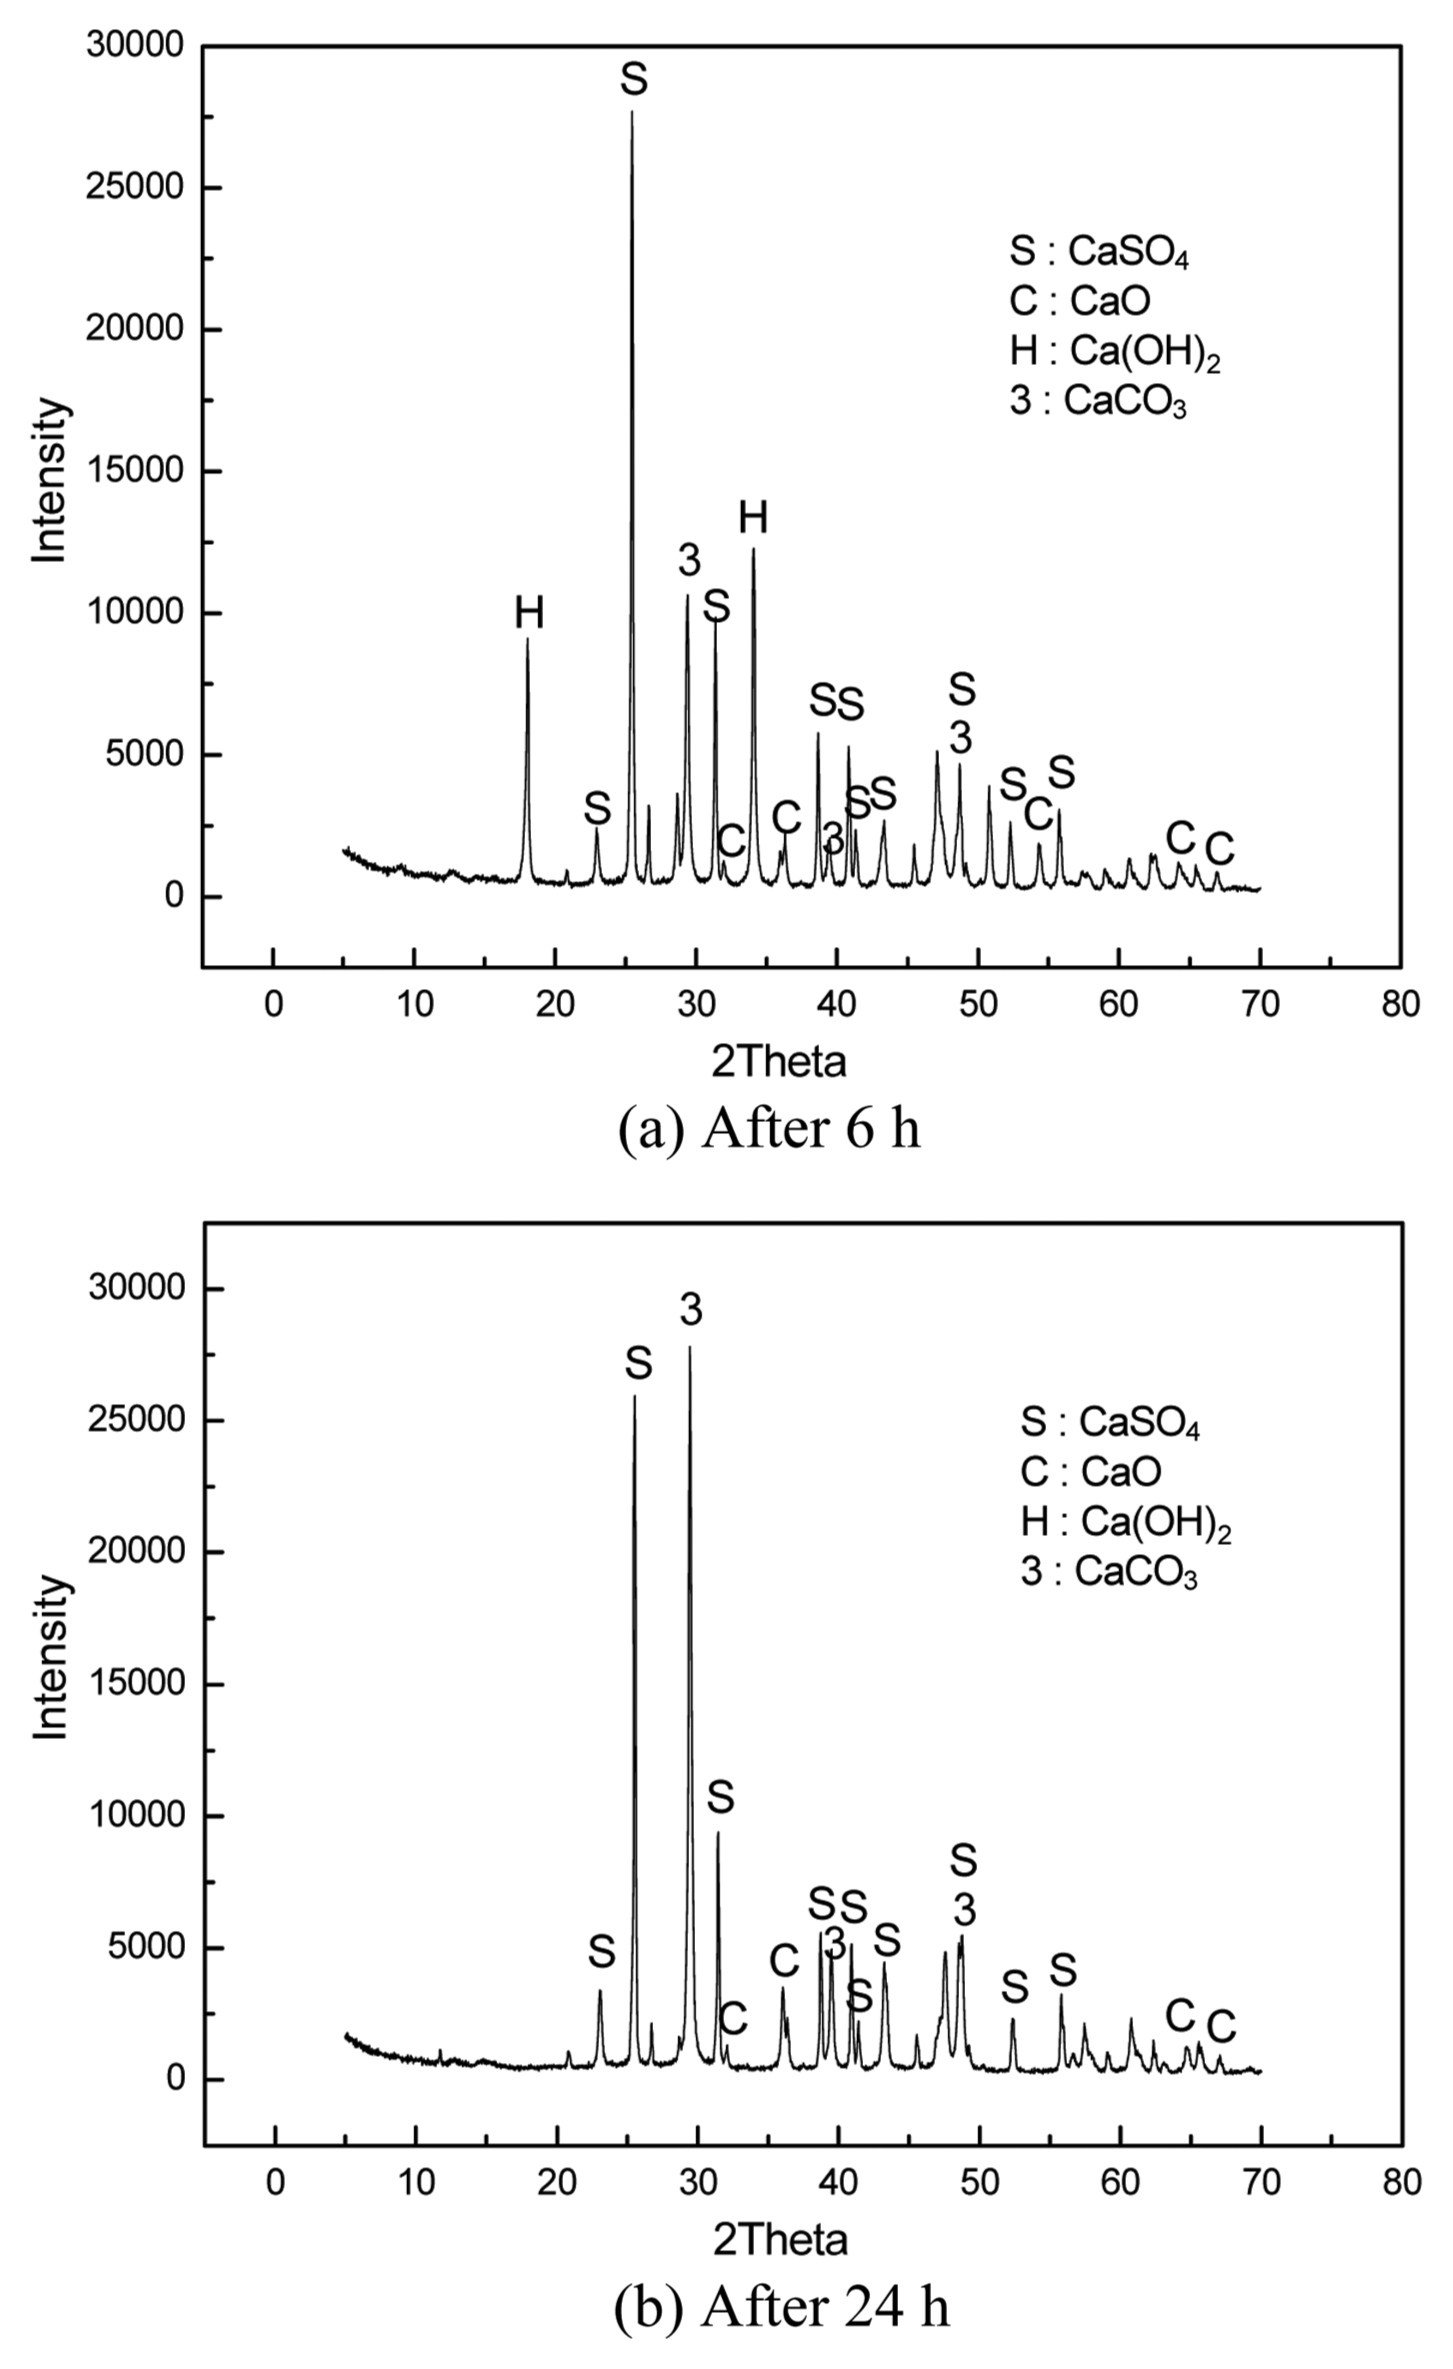
Figures 4 and 5 show the XRD patterns of the dry desulfurized gypsum samples after the carbonization and drying of the slurry depending on the sample carbonization time. Figs. 4 and 5 are the XRD patterns of the samples prepared with mixing water contents of 1 : 2 and 1 : 3, respectively.
The degree of carbonization was not significantly dependent on the ratio of the mixing water, as can be seen from the difference in the primary peak intensity (2θ≒29°) of CaCO3 between Figs. 4 and 5. The peak intensity obtained from the sample prepared with the mixing water ratio of 1 : 2 was 10,758 CPS (count per second), which was similar to the peak intensity at 1 : 3 (10,642 CPS). Therefore, the ratio of the mixing water may not have a significant effect on the carbonization of dry desulfurized gypsum.
The Ca(OH)2 peak indicated that the carbonization was not completed after 6 h. The Ca(OH)2 peak intensity (2θ≒18°) increased initially as the hydration reaction continued with the mixing water, but started to be decrease after 6 h. This means that the carbonization of Ca(OH)2 was greater than the hydration of CaO for 6 h, but the hydration of CaO was dominant over the carbonization of Ca(OH)2 after 6 h. The sample after 24 h of carbonization showed almost no Ca(OH)2 peak because most of the Ca(OH)2 was carbonized. In contrast, the sample after 24 h of carbonization showed a significant increase in the CaCO3 peak, confirming that most of the Ca(OH)2 was carbonized into CaCO3.
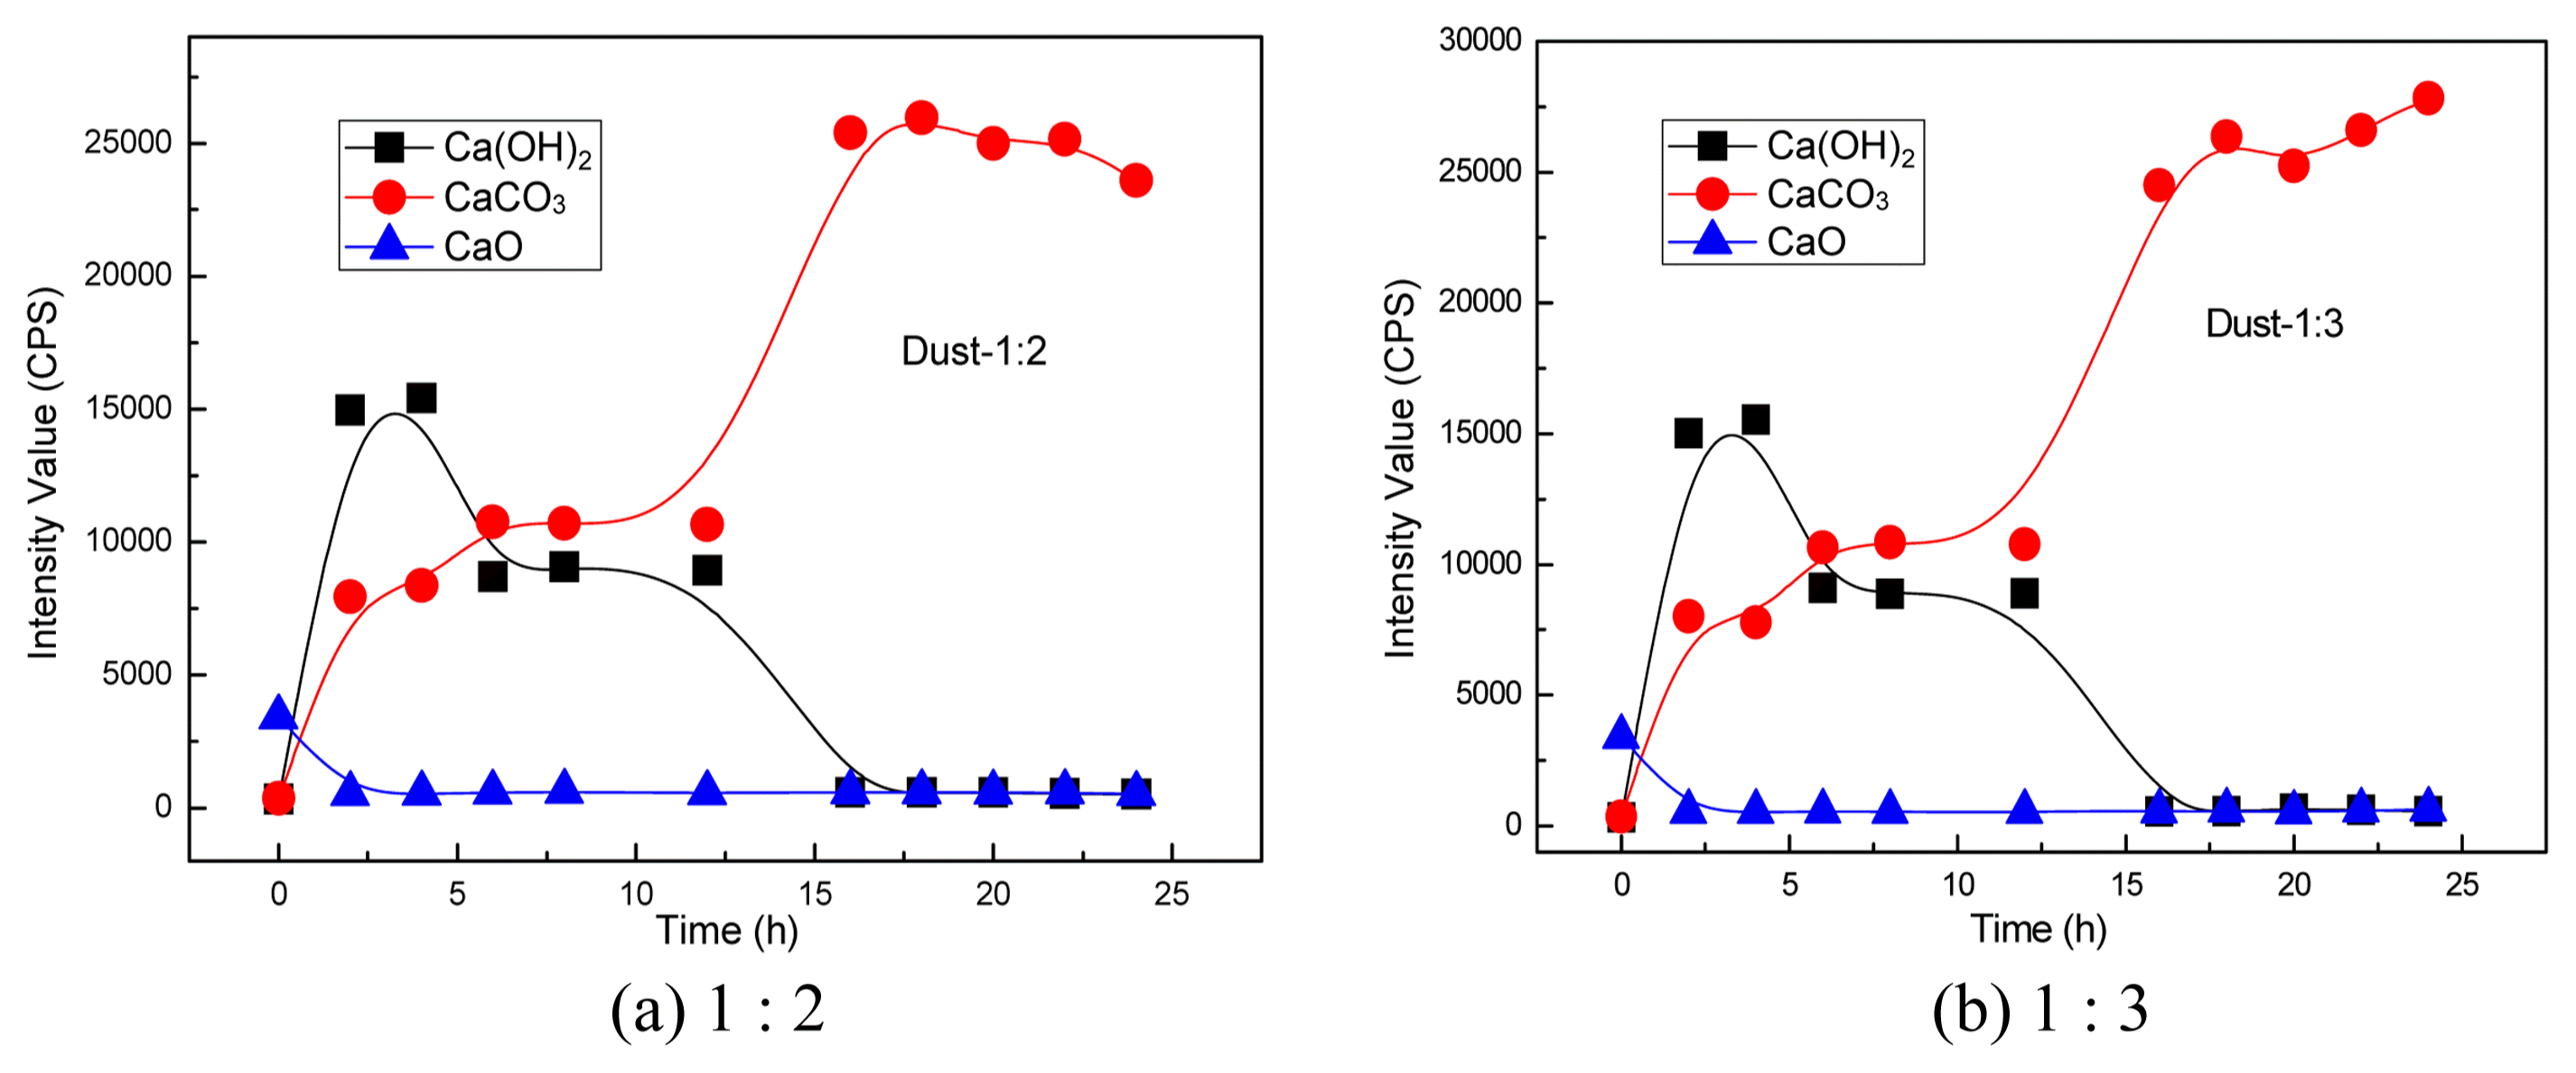
Figure 6 is a plot showing the change in the peak intensity of the crystals. With the increase in carbonization time, the CaCO3 peak intensity was increased, but the increase was not significant between 6 h and 14 h. However, after 14 h, the CaCO3 peak intensity increased significantly until 18 h.
However, the CaCO3 peak intensity did not significantly change after 18 h. In contrast, the Ca(OH)2 peak intensity increased in the first 4 h and then decreased. Between 4 h and 14 h, the Ca(OH)2 peak intensity was almost constant. The peak intensity decreased between 14 h and 16 h and then remained almost constant after 16 h.
These XRD patterns, depending on the progress of the carbonization of the dry desulfurized gypsum, indicated that carbonization was active primarily in the initial 6 h, as shown by the CaCO3 peak. The Ca(OH)2 peak intensity also showed a similar result. Between 4 h and 6 h, the production of Ca(OH)2 from CaO and the production of CaCO3 from Ca(OH)2 were similar, and thus the production of Ca(OH)2 may have been offset by the consumption of the Ca(OH)2. Then, between 6 h and 14 h, the carbonization may have been stopped. Subsequently, from 14 h, the carbonization occurred rapidly as a secondary carbonization that continued until 16 h. The carbonization after 16 h was negligible. This result shows that the dry desulfurized gypsum underwent a two-step carbonization process, which may be considered a critical factor for controlling the carbonization. The result shows that the first step of carbonization was during the initial 6 h, and the second step of carbonization was between 14 h and 16 h.
Figure 7 shows the carbonization mechanism of the dry desulfurized gypsum. The carbonization process may be expressed as follows based on the dry desulfurized gypsum carbonization experimental results. As shown in Fig. 7(a), the carbonization of the Ca(OH)2 crystals produced by the hydration with the mixing water starts on the surface. As a result, CaCO3 crystals are formed on the Ca(OH)2 crystal surfaces, and the produced CaCO3 crystals continuously grow with the supply of the CO2 gas, as shown in Fig. 7(b). With the growth of the CaCO3 crystals, the CaCO3 crystal growth pressure (expansion pressure) is applied to the Ca(OH)2 surfaces, destroying the Ca(OH)2 surfaces. Water molecules and Ca2+ ions may be transported through the fracture surfaces generated by the CaCO3 expansion pressure to continuously produce CaCO3.
If the mechanism of dry desulfurized gypsum carbonization is assumed as described above, the first step of carbonization may correspond to Fig. 7(a), the initial CaCO3 crystal production after the mixing of water. The second step of carbonization may correspond to Fig. 7(c), the secondary production of CaCO3 following ion transport through the fracture surfaces.
Based on the XRD patterns and the carbonization mechanism described above, the appropriate duration of dry desulfurized gypsum carbonization may be at least 16 h.
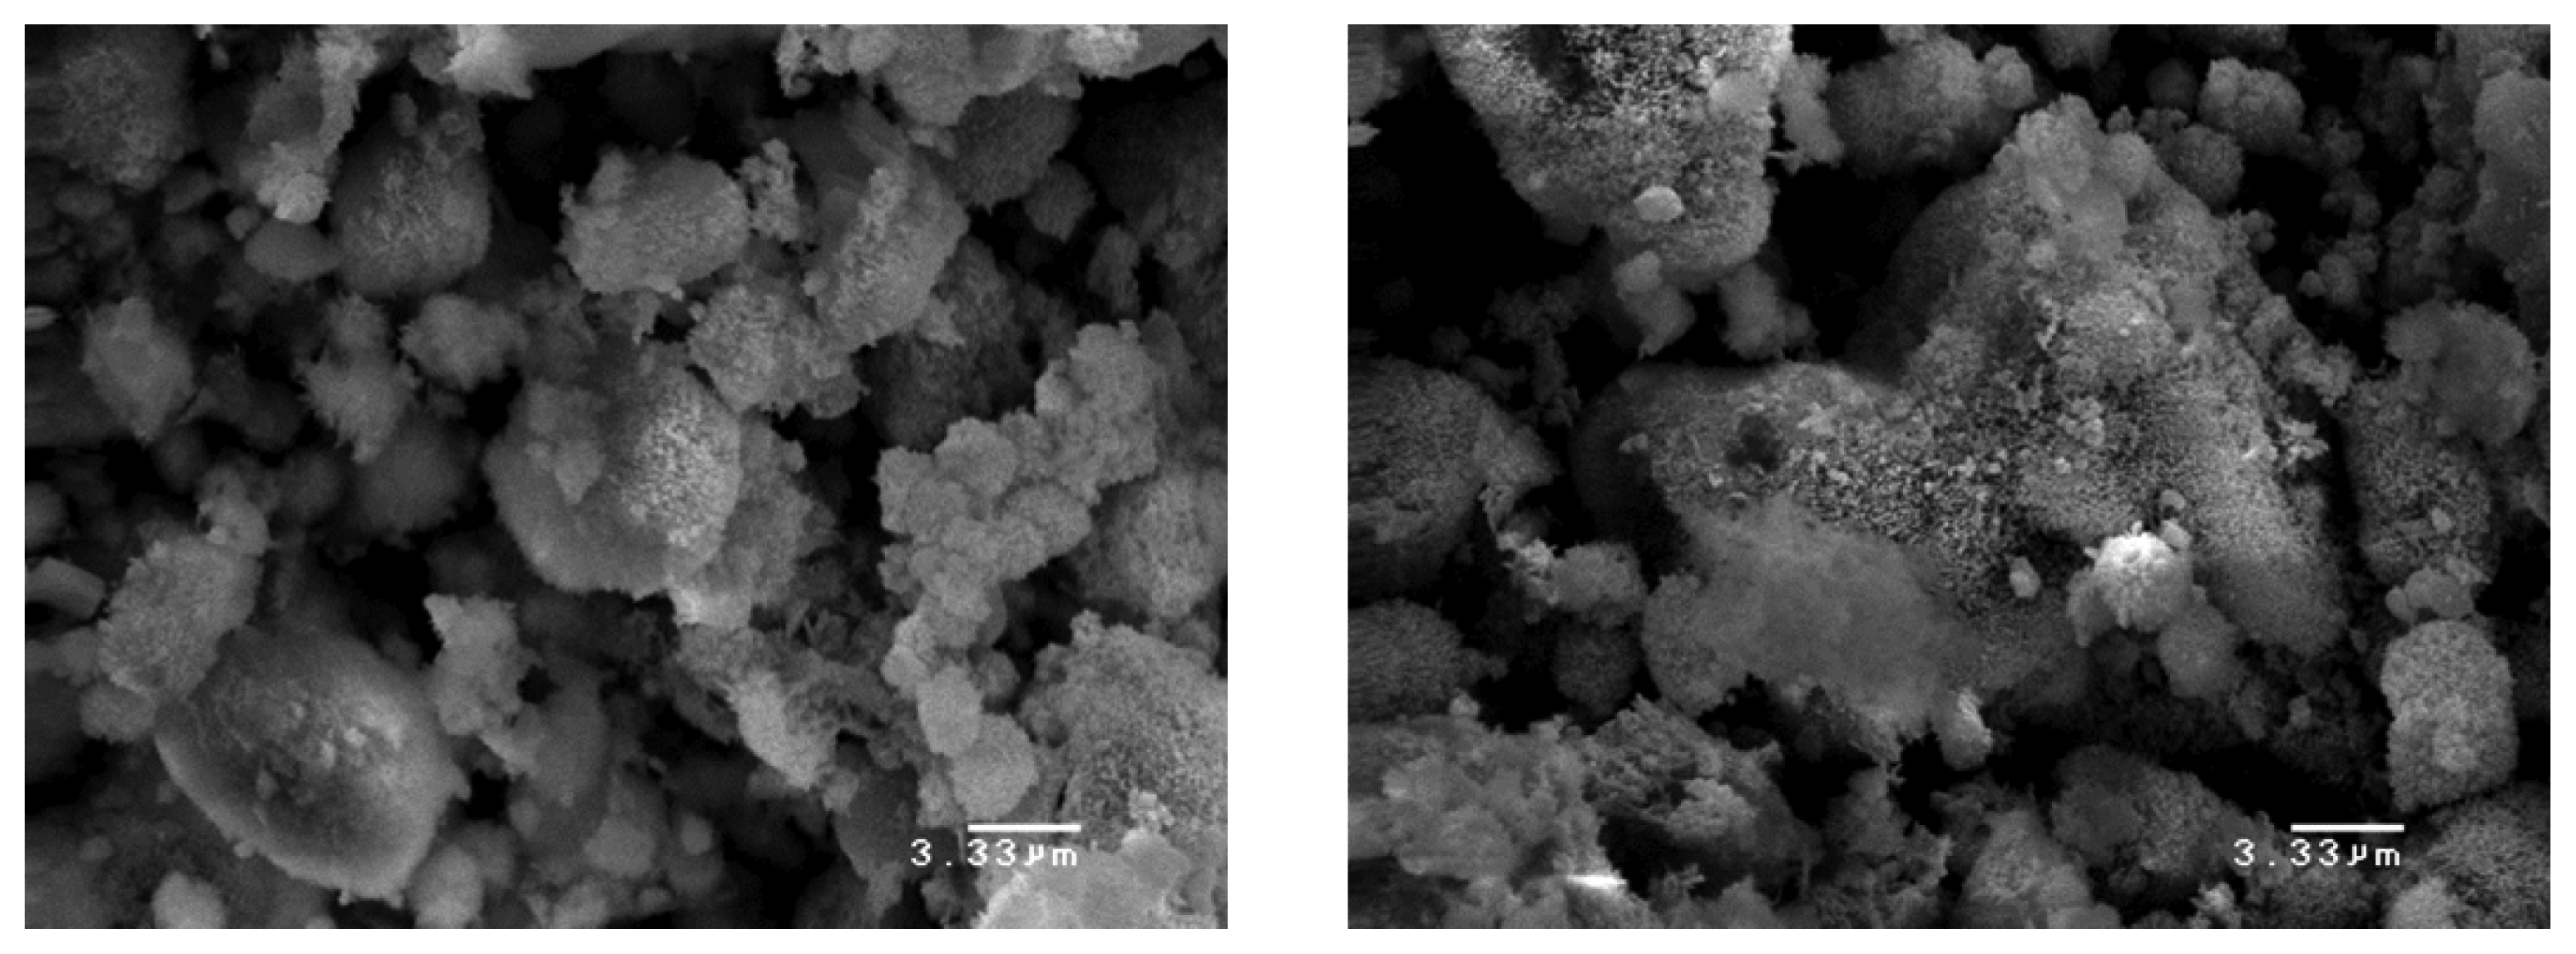
Figures 8 and 9 are SEM images showing the microstructure of the dry desulfurized gypsum after carbonization for 6 h and 24 h, respectively. The sample after 6 h showed CaCO3 (fine grains in appearance) on some of the planar Ca(OH)2 crystal surfaces, but other Ca(OH)2 surfaces remained unchanged. In the sample after 24 h of carbonization, most of the Ca(OH)2 crystals were converted to CaCO3 grains. The analysis of the microstructure also showed that carbonization of the dry desulfurized gypsum was almost complete after 24 h of carbonization. This result was consistent with the XRD patterns (peak intensity analysis).
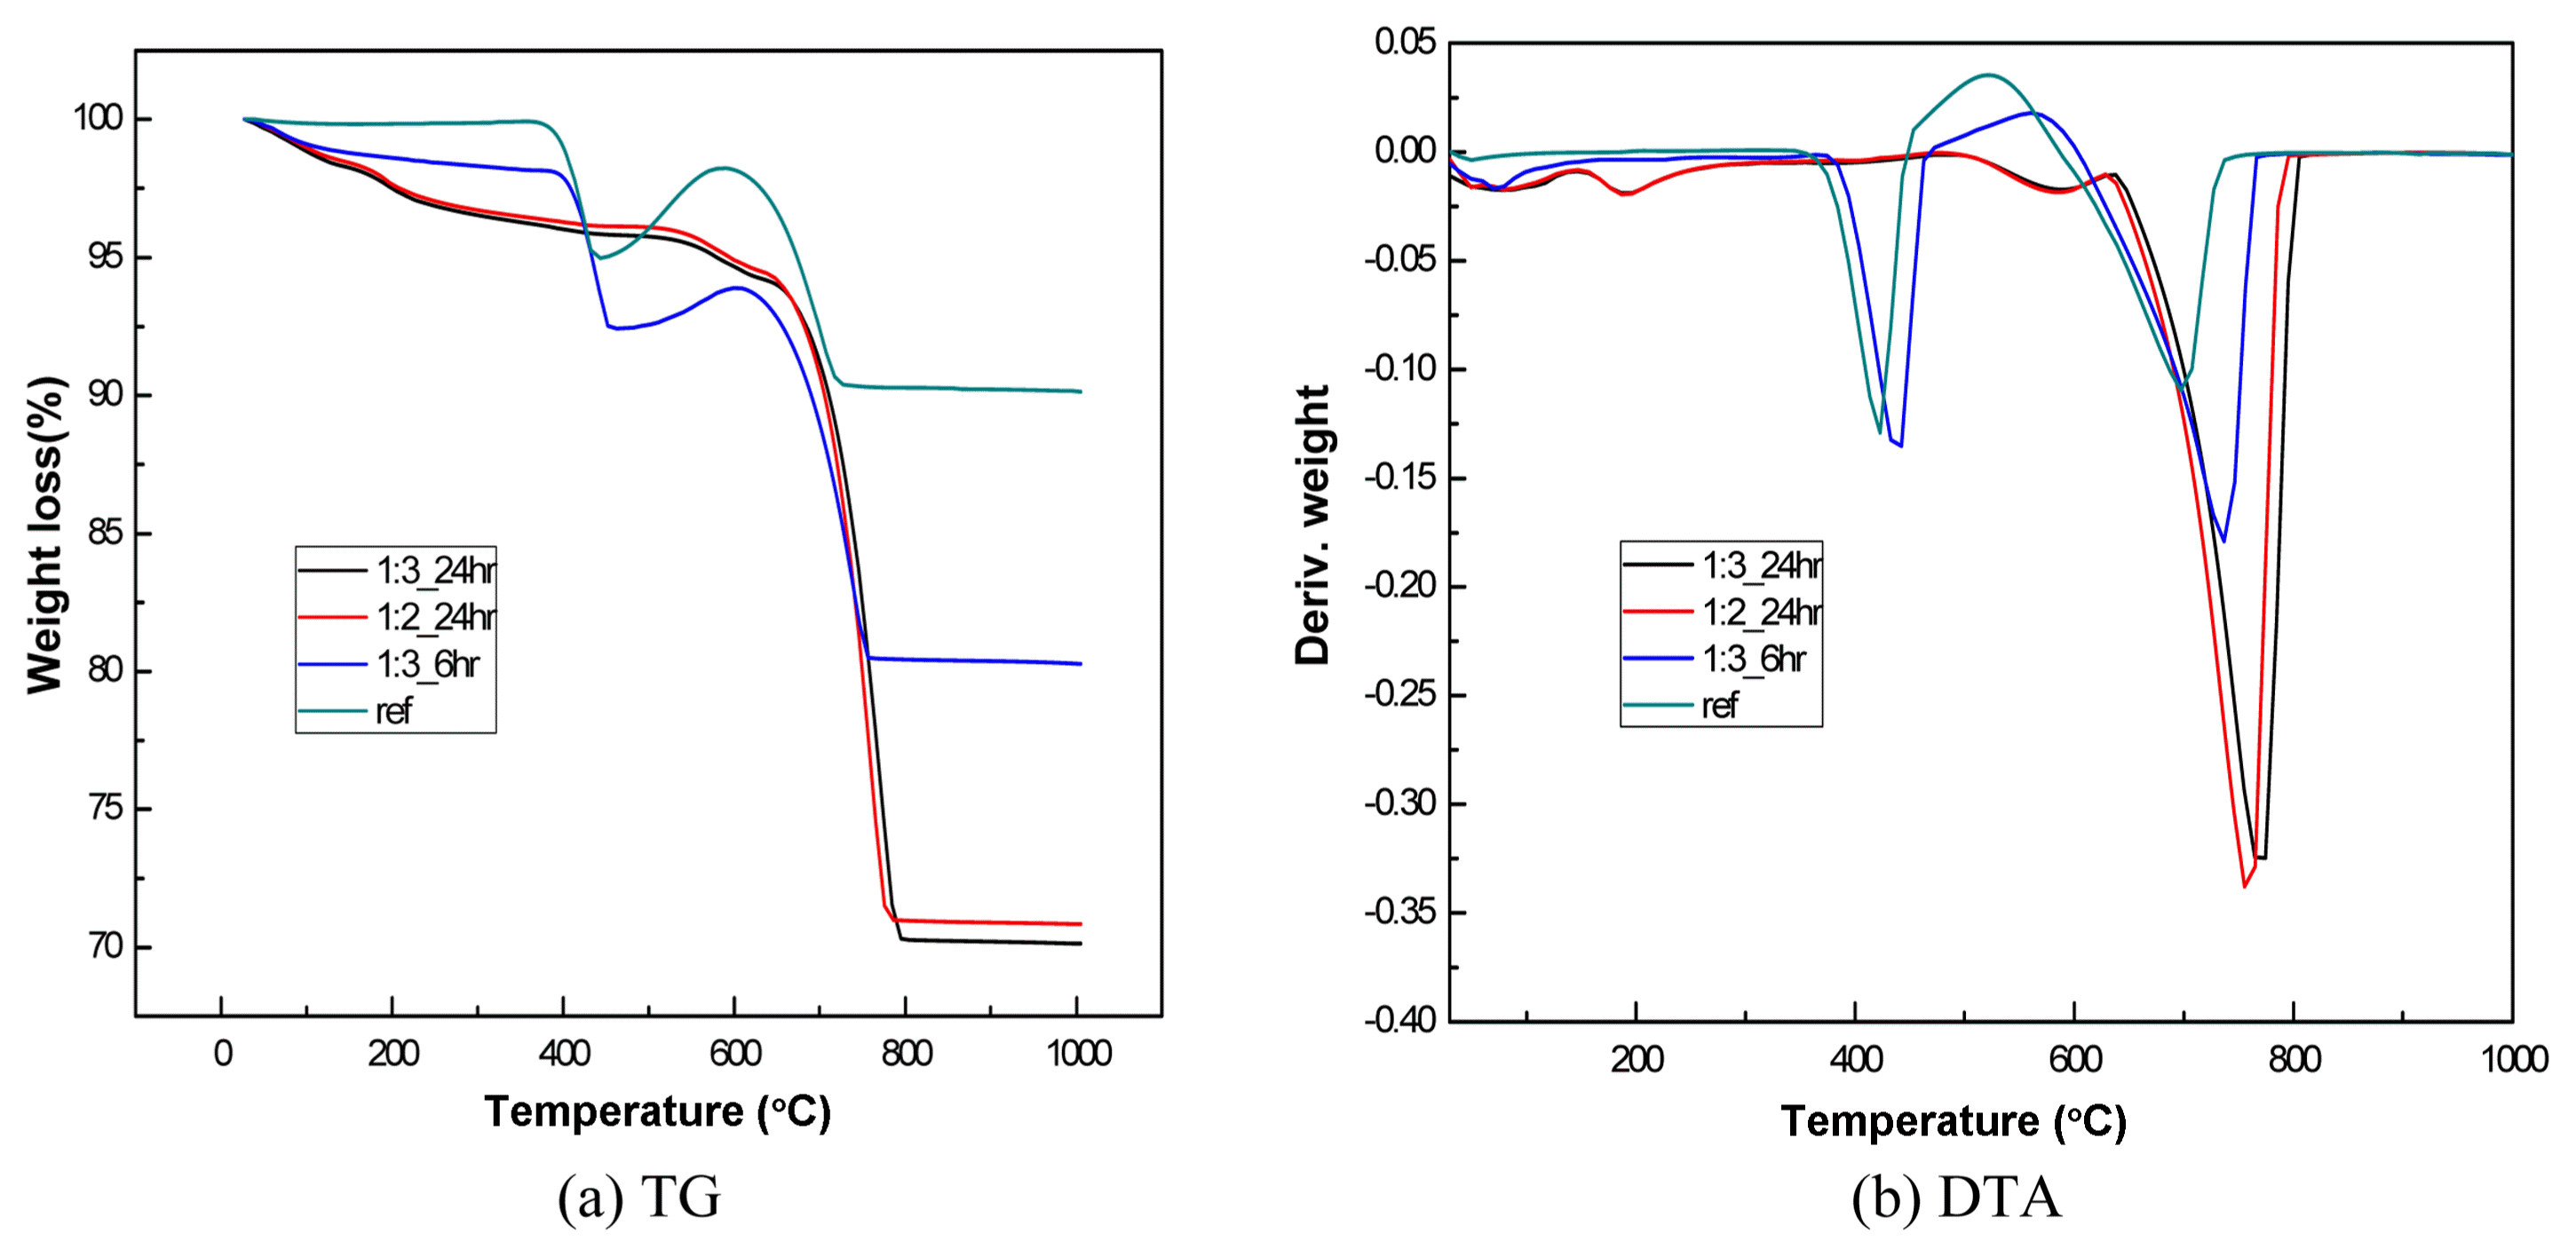
A thermal analysis (TG-DTA) was performed to quantitatively evaluate the degree of carbonization, and the result is shown in Fig. 10.
The result of the thermal analysis showed that the weight of the carbonized dry desulfurized gypsum was decreased at about 700°C by a de-carbonization reaction. The weight was significantly decreased, particularly in the sample carbonized for 24 h. In addition, the DTA plot showed an endothermic peak. The decrease of the weight of the sample carbonized for 24 h was about 23.0% at the 1 : 2 mixing ratio and about 24% at the 1 : 3 mixing ratio. The weight decrease may have been caused by the following de-carbonization reaction of CaCO3:
Assuming that the total weight of the dry desulfurized gypsum was 100 g, the weight decrease by the de-carbonization was 23%, and thus the weight of CO2 may have been 23.0 g and the weight of CaCO3 52.3 g. However, since the dry desulfurized gypsum used in the present study included a certain amount of limestone, the weight of the limestone should be corrected to quantify the amount of absorbed CO2 per unit desulfurized gypsum weight.
As shown in Fig. 9, the thermal analysis of the dry desulfurized gypsum before carbonization showed that the decrease in weight produced by the de-carbonization was about 8% and thus the decrease of the weight of just the dry desulfurized gypsum was about 16%. Thus, if dry desulfurized gypsum is carbonized with CO2 discharged from CO2-discharging factories, the CO2 absorption may be about 16% of the weight of the dry desulfurized gypsum.
For example, if one ton of dry desulfurized gypsum is carbonized, about 160 kg of CO2 may be absorbed. A similar result was found with the sample at the mixing ratio of 1 : 2.
Therefore, carbonization time is a more important factor affecting the efficiency of dry desulfurized gypsum carbonization than the ratio of dry desulfurized gypsum to mixing water.
4. Conclusions
The present study was conducted to investigate carbonized slurries prepared using dry desulfurized gypsum from industrial byproducts, and their ability to absorb a large amount of CO2. The following conclusions were made by analyzing the microstructure of the carbonized dry desulfurized gypsum and performing an XRD analysis and a thermal analysis. Ca(OH)2 hydrates produced by the reaction of CaO with water in the air were also found. The dry desulfurized gypsum did not have a specific microstructure and the mean particle diameter was about 20 μm.
The analysis of the XRD patterns of the samples carbonized using the slurries prepared by mixing dry desulfurized gypsum with mixing water at the ratios of 1 : 2 and 1 : 3 showed that the degree of carbonization was not significantly dependent on the ratio of the mixing water. The Ca(OH)2 peak still remained after 6 h of carbonization. Most Ca(OH)2 was carbonized and converted into CaCO3 after 24 h of carbonization. The carbonization of dry desulfurized gypsum included two steps: a primary carbonization in the initial 6 h and a secondary carbonization between 14 h and 16 h. The appropriate carbonization time for dry desulfurized gypsum may be 16 h.
The SEM images of the microstructure of the carbonized dry desulfurized gypsum samples showed that some CaCO3 (fine grains in appearance) was formed on some of the planar Ca(OH)2 after 6 h of carbonization. In the sample after 24 h of carbonization, the Ca(OH)2 crystals were completely converted into CaCO3 grains, which was consistent with the XRD pattern analysis result.
The TG-DTA result for the quantitative evaluation of the carbonization of the dry desulfurized gypsum showed that the weight of the sample had decreased after 24 h by about 23% to 24% due to de-carbonization. The correction of the limestone content revealed that the CO2 absorption may be about 16% of the weight of the dry desulfurized gypsum.


