1. Introduction
Environmental issues are usually connected with commercial dyes; it is evaluated that more than 10000 colors and shades are as-of-recently utilized as a part of modern innovations, i.e. textiles, paper, food, cosmetic and drug manufacture and medication fabrication. Many of these colors contain an extensive number of organic compounds and release dangerous effluents, which can influence human and also oceanic life.1,2) As a result, the destruction of color dyes in wastewater has come under increasing consideration. Various procedures, i.e. electron oxidation, ozonation, electro-active particle coagulation, layer filtration and microbial degradation have been investigated to eliminate dyes.3-8) All the previously mentioned methods have certain advantages and disadvantages over alternate systems. In this manner, helpful methods are required to degrade dye in water. Recently, the focus has been on semiconductor photo catalysis in the expulsion of color dyes from wastewater, especially the ability of this method to totally mineralize the objective toxins.9) Heterogeneous photocatalysis covers various components and involves diverse fields of science. Physical, chemical and biological engineering are used in the different approaches; for example, photo electrochemical cells working in watery or organic solvents are also generally explored for the transformation of light into electricity.9) Substance photosynthesis and fuel production are other vital uses of heterogeneous photocatalytic systems.10,11) Different semiconductor materials, for example, TiO2, ZnO and CdS, have been reliably utilized in their synergist degradation to resolve ecological contamination issues. However, functional applications are constrained because of the high recombination rate of photo induced charge carriers and the high band gap energy.12-15) Hence, to improve the productivity of TiO2, different strategies have been used; for example, the doping of metals or their oxides (e.g. Cu,16) Ag17) and Pd18) when these metals fill the interstitial sites) and the replacing of Ti in substitutional sites or the forming of agglomerates on the surface of TiO2, hence changing the properties of TiO2. Additionally, very easy to obtain from low-cost graphite using the Hummer’s method.19,20) Due to its unique properties (surface functionalities, huge surface zone and steadiness), graphene is a reasonable possibility to grapple to the surface of semiconductor materials (TiO2) and can enhance the charge exchange mechanism. The oxygen functionalities adjust the particle size and state of the semiconductor materials on the surface of graphene. Chen et al. showed that graphene is an incredible supporter to grapple TiO2 nanocrystals for the amalgamation of graphene-TiO2, in light of the fact that graphene works as a photosensitizer to increase the light response of TiO2 towards the towards the visible range of the electromagnetic spectrum.21) Furthermore, due to its unique electronic and optical properties, metal selenide has attracted considerable attention over the past few decades. Metal selenide has been combined with large band gap semiconductors (TiO2) to upgrade the photocatalytic efficiency. 22) Silver selenide is accessible in various phases (α-Ag2Se high temperature stage and β-Ag2Se low temperature stage) with a phase transition at 1331°C.23) α-Ag2Se is a known superionic conductor and is for the most part utilized as a strong electrolyte in photorechargeable secondary batteries; on the other hand, because of its limited band gap, β-Ag2Se is comprehensively utilized as a photosensitizer in thermalchromic materials. Cao et al. used solvothermal strategies to incorporate a single-crystalline Ag2Se complex nanostructure, the consequence of which demonstrated that the nanostructure has a magnificent photocatalytic activity by the photodegradation of rhodanmin B (RhB) color utilizing UV light irradiation.24) In this paper, we prepare an Ag2Se-G-TiO2 ternary nano composite through ultra sonication technique and study the photocatalytic action under visible light through degradation of industrial dyes (Rh B).
2. Experimental Procedure
2.1. Materials
Silver nitrate (AgNO3), selenium powder (Se, 99%), ammonium hydroxide (NH4OH, 25 - 28%), sodium sulfite (Na2SO3·7H2O, 95%) and titanium (IV) n-butoxide (TNB, C16H36O4Ti) were purchased from Duksan Pure Chemicals Co. Ltd., Republic of Korea. All chemicals were utilized without further cleaning. All arrangements were utilized with refined water.
2.2. Preparation of Ag2Se-graphene-TiO2 composite
Typical preparations of Ag2Se-G-TiO2 nanocomposite are as per the following. 3 g of Na2SO3 and 0.3 g of selenium power (Se) were mixed with 50 ml DI water and refluxed for 2 h to shape Na2SeSO3 to frame arrangement A. At that point, 400 mg graphene oxide (GO) and Ag2NO3 (0.02 g) were mixed in 60 ml ethylene glycol by ultra-sonication for 4 h to form a graphene oxide nanosheet (GONS)/Ag+2 for solution B. Solutions A and B were then blended and heated at 60°C for 30 min to obtain a homogenous solution. Finally, a molar ratio of ethanol : H2O : TNB = 35 : 15 : 4 was added to the acquired solution and sonicated at room temperature for 2 h utilizing a controllable serial-ultrasonic contraption (Ultrasonic Processor, VCX 750, 500 watt, Korea, Power 500 Watt, recurrence 20 KHz, Amplitude half and low force). The reaction solution was then left to cool and settle at room temperature subsequent to sifting with 47 mm Whatman filter paper at a pore size of 0.7 mm. The resultant powder was washed with refined water five times, and dried in a vacuum stove at 100°C for 12 h; the solution was then moved to an electric heater for heat treatment at 500°C for 2 h. A similar system was used after for the other control tests of Ag2Se and Ag2Se-graphene. The fabricated nanocomposites were named Ag2Se, Ag2Se-graphene and Ag2Se-graphene-TiO2.
2.3. Characterization
XRD (Shimadzu XD-D1, Uki, Kumamoto, Japan) was used to determine the crystallinity of the composite with monochromatic high-intensity CuKα radiation (λ = 1.5406 A). SEM (JSM-5600, JEOL Ltd., Tokyo, Japan) was used to examine the surface morphology of the Ag2Se-G-TiO2 nanocomposite. Transmission electron microscopy (TEM, JEOL, JEM-2010, Japan) was used to determine the state and particle size of the prepared composite; and Raman spectra of the prepared samples were obtained using a spectrometer (Jasco Model Name NRS-3100) with an excitation laser wavelength of 532.06 nm. The photocatalytic performance of the prepared samples was investigated by absorbance spectrometry with a UV/Vis spectrophotometer (Optizen POP, Mecasys, Korea).
2.4. Photocatalytic degradation experiment of Rh B
The adsorption and photocatalytic execution of the as-arranged Ag2Se-G-TiO2 was assessed by the degradation of Rh B color under visible light. A xenon (8 W, λ > 420 nm) lamp was utilized as a light source. In the investigation, 30 mg of Ag2Se-G-TiO2 catalytic sample was dispersed on a 100 ml arrangement of Rh B (4.0 × 10⁻⁶ mol/L). In order to reach the adsorption-desorption equilibrium, the solution was kept in the dark for 2 h. At that point, 10 ml specimens were gathered from the solution and kept in a rotator at 10,000 rpm for the elimination of solid materials. After that, the light source was turned on. The examples were gathered after 30 min; after that, they were centrifuged for 10 min to evacuate any suspended strong. Every one of the samples was illuminated for 180 min to determine their synergist efficiency.
3. Results and Discussion
3.1. Characterization
The phase structure of the arranged (Ag2Se-G-TiO2) nanocomposite was subject to investigation by X-beam diffraction (XRD). Fig. 1 shows that the XRD example of Ag2Se-G has diffraction peaks at around 2θ of 25.20, 30.88, 32.52, 34.63, 36.95, 39.98, 40.20, 42.65 and 43.380 which can be ordered to the characteristic peak (101), (102), (120), (112), (121), (013), (122), (113) and (201) plane reflections, individually, with orthorhombic Ag2Se phase with grid parameters of a = 4.33 A0, b = and c = 7.06 A0, (JCPDS PDF#00-024-1401).25) The TiO2 peaks showed up at around 2θ = 25.20, 47.99, 53.82, 55.01, 62.62 and 68.75°, and were related to the (101), (200), (105), (211), (204) and (116) diffractions as the anatase crystal phase with lattice parameters a = b 3.78 A0 and c = 9.51 A0 (JCPDS PDF#00-021-1279). The TiO2 (101) and graphene (002) peaks cover each other at the same 2θ values; it is therefore exceptionally hard to separate these peaks and the diffraction peaks of the TiO2 and graphene are low, showing that graphene oxide has been decreased to graphene.26,27) Furthermore, the variance of the diffraction peaks of the Ag2Se-G-TiO2 nanocomposites likewise exhibits the expanded measure of graphene and the suppression of the crystalline phase. The pressure at the peak intensity shows that the lattice structure of Ag2Se is misshaped by the cooperation with GO.28,29)
The essential microanalysis results of Ag2Se-G-TiO2 were analyzed by EDX spectra, as displayed in Fig. 2, which shows the presences of the main elements in the catalyst composites. The figure demonstrates that presences of the prime components C, O, Ag and Se were detected. The C basic elemental peak was derived from the graphene sheet; Ag2Se and O are the precursor material. Besides this, strong Kα and Kβ of the Ti component peaks appear at 0.50 keV, 4.51 keV and 4.92 KeV, while Se peaks appear at 11.2 KeV and 12.5 KeV and an O peak shows up at 0.54 KeV.30) However, because of incidental instrumental contact or dealing with strategies, low measures of different contaminants were also detected.
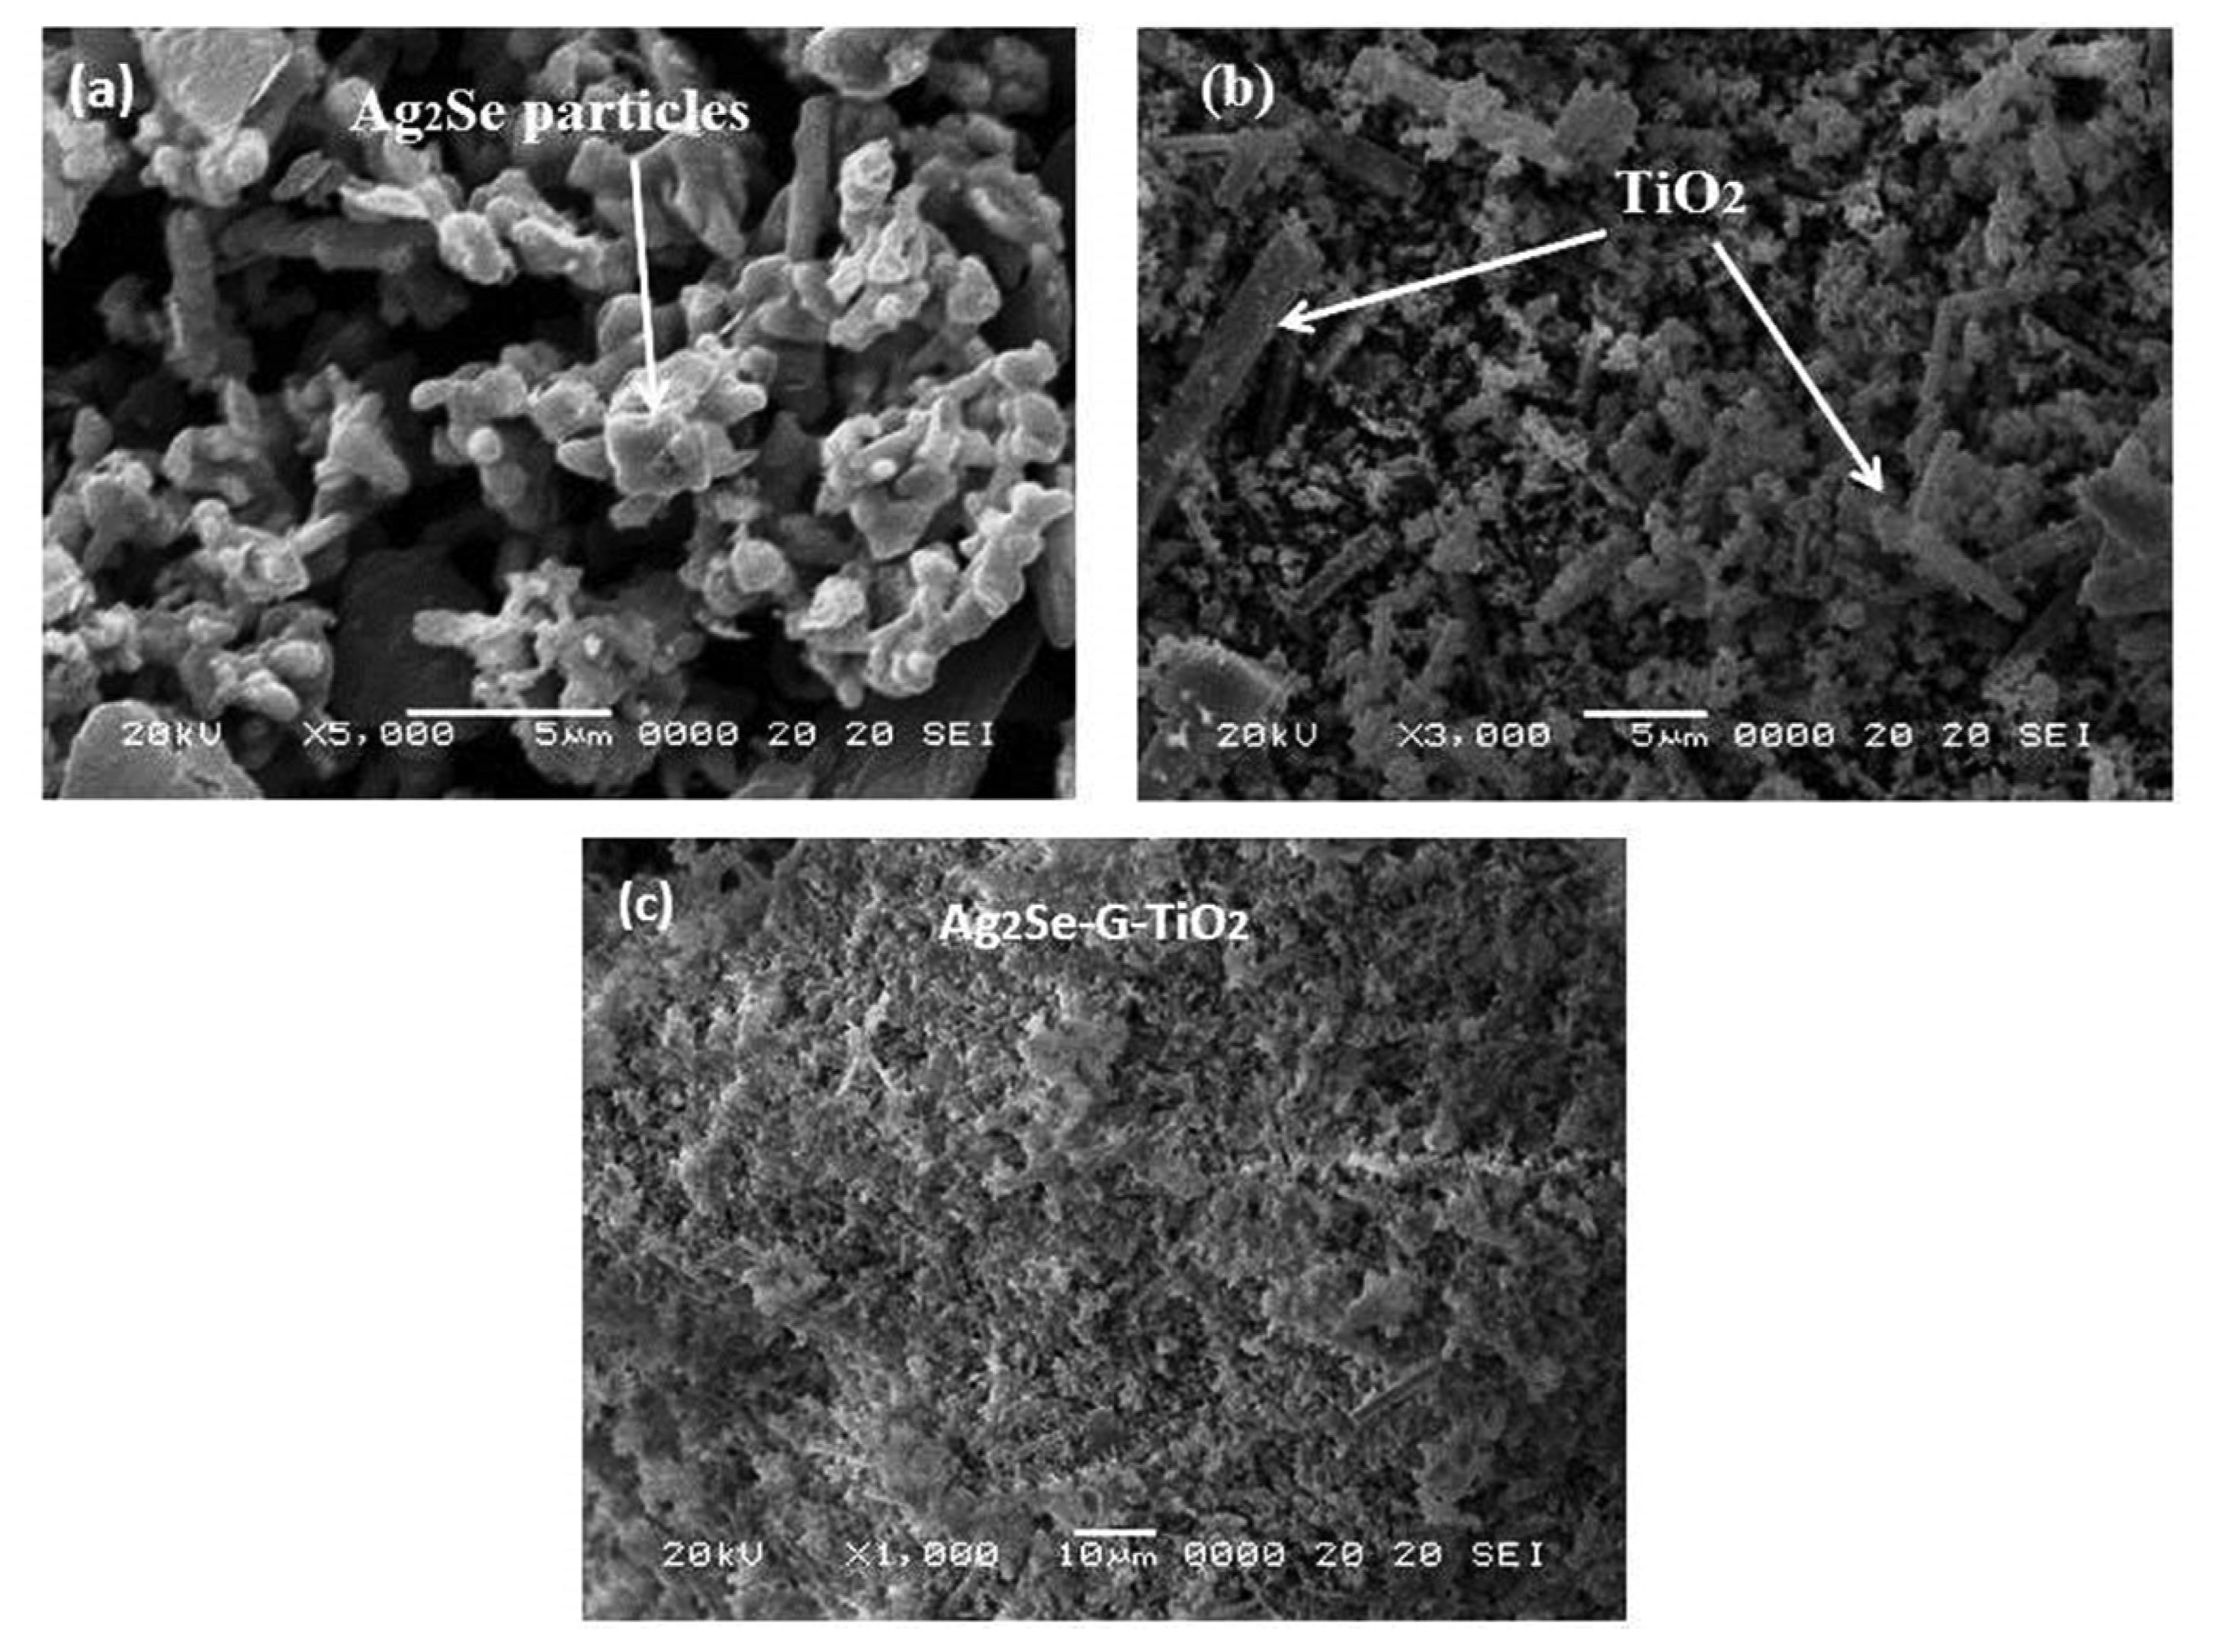
Figure 3(a), obtained by SEM, depicts the general morphology of the prepared sample; image demonstrates that the Ag2Se particles are consistently exasperates graphene oxide sheets, but the particle size and shape are hard to recognize in the SEM image. The graphene appears as a sheet-like structure that is broken off in different directions, with a nanocomposite plate-like shape with partial agglomeration; this plate-like structure shows the presence of oxygen functionalities on the surface of the graphene.31) Fig. 3(b) shows TiO2 particles with a practically circular shape, consistently disseminated on the graphene sheet. And, Fig. 3(c) shows the distinction between the binary and ternary composites. After the coupling of TiO2, a brighter spot shows up in the ternary composite, demonstrating that the synthesis union of Ag2Se-G-TiO2 particles was effective and has a proper distribution pattern.
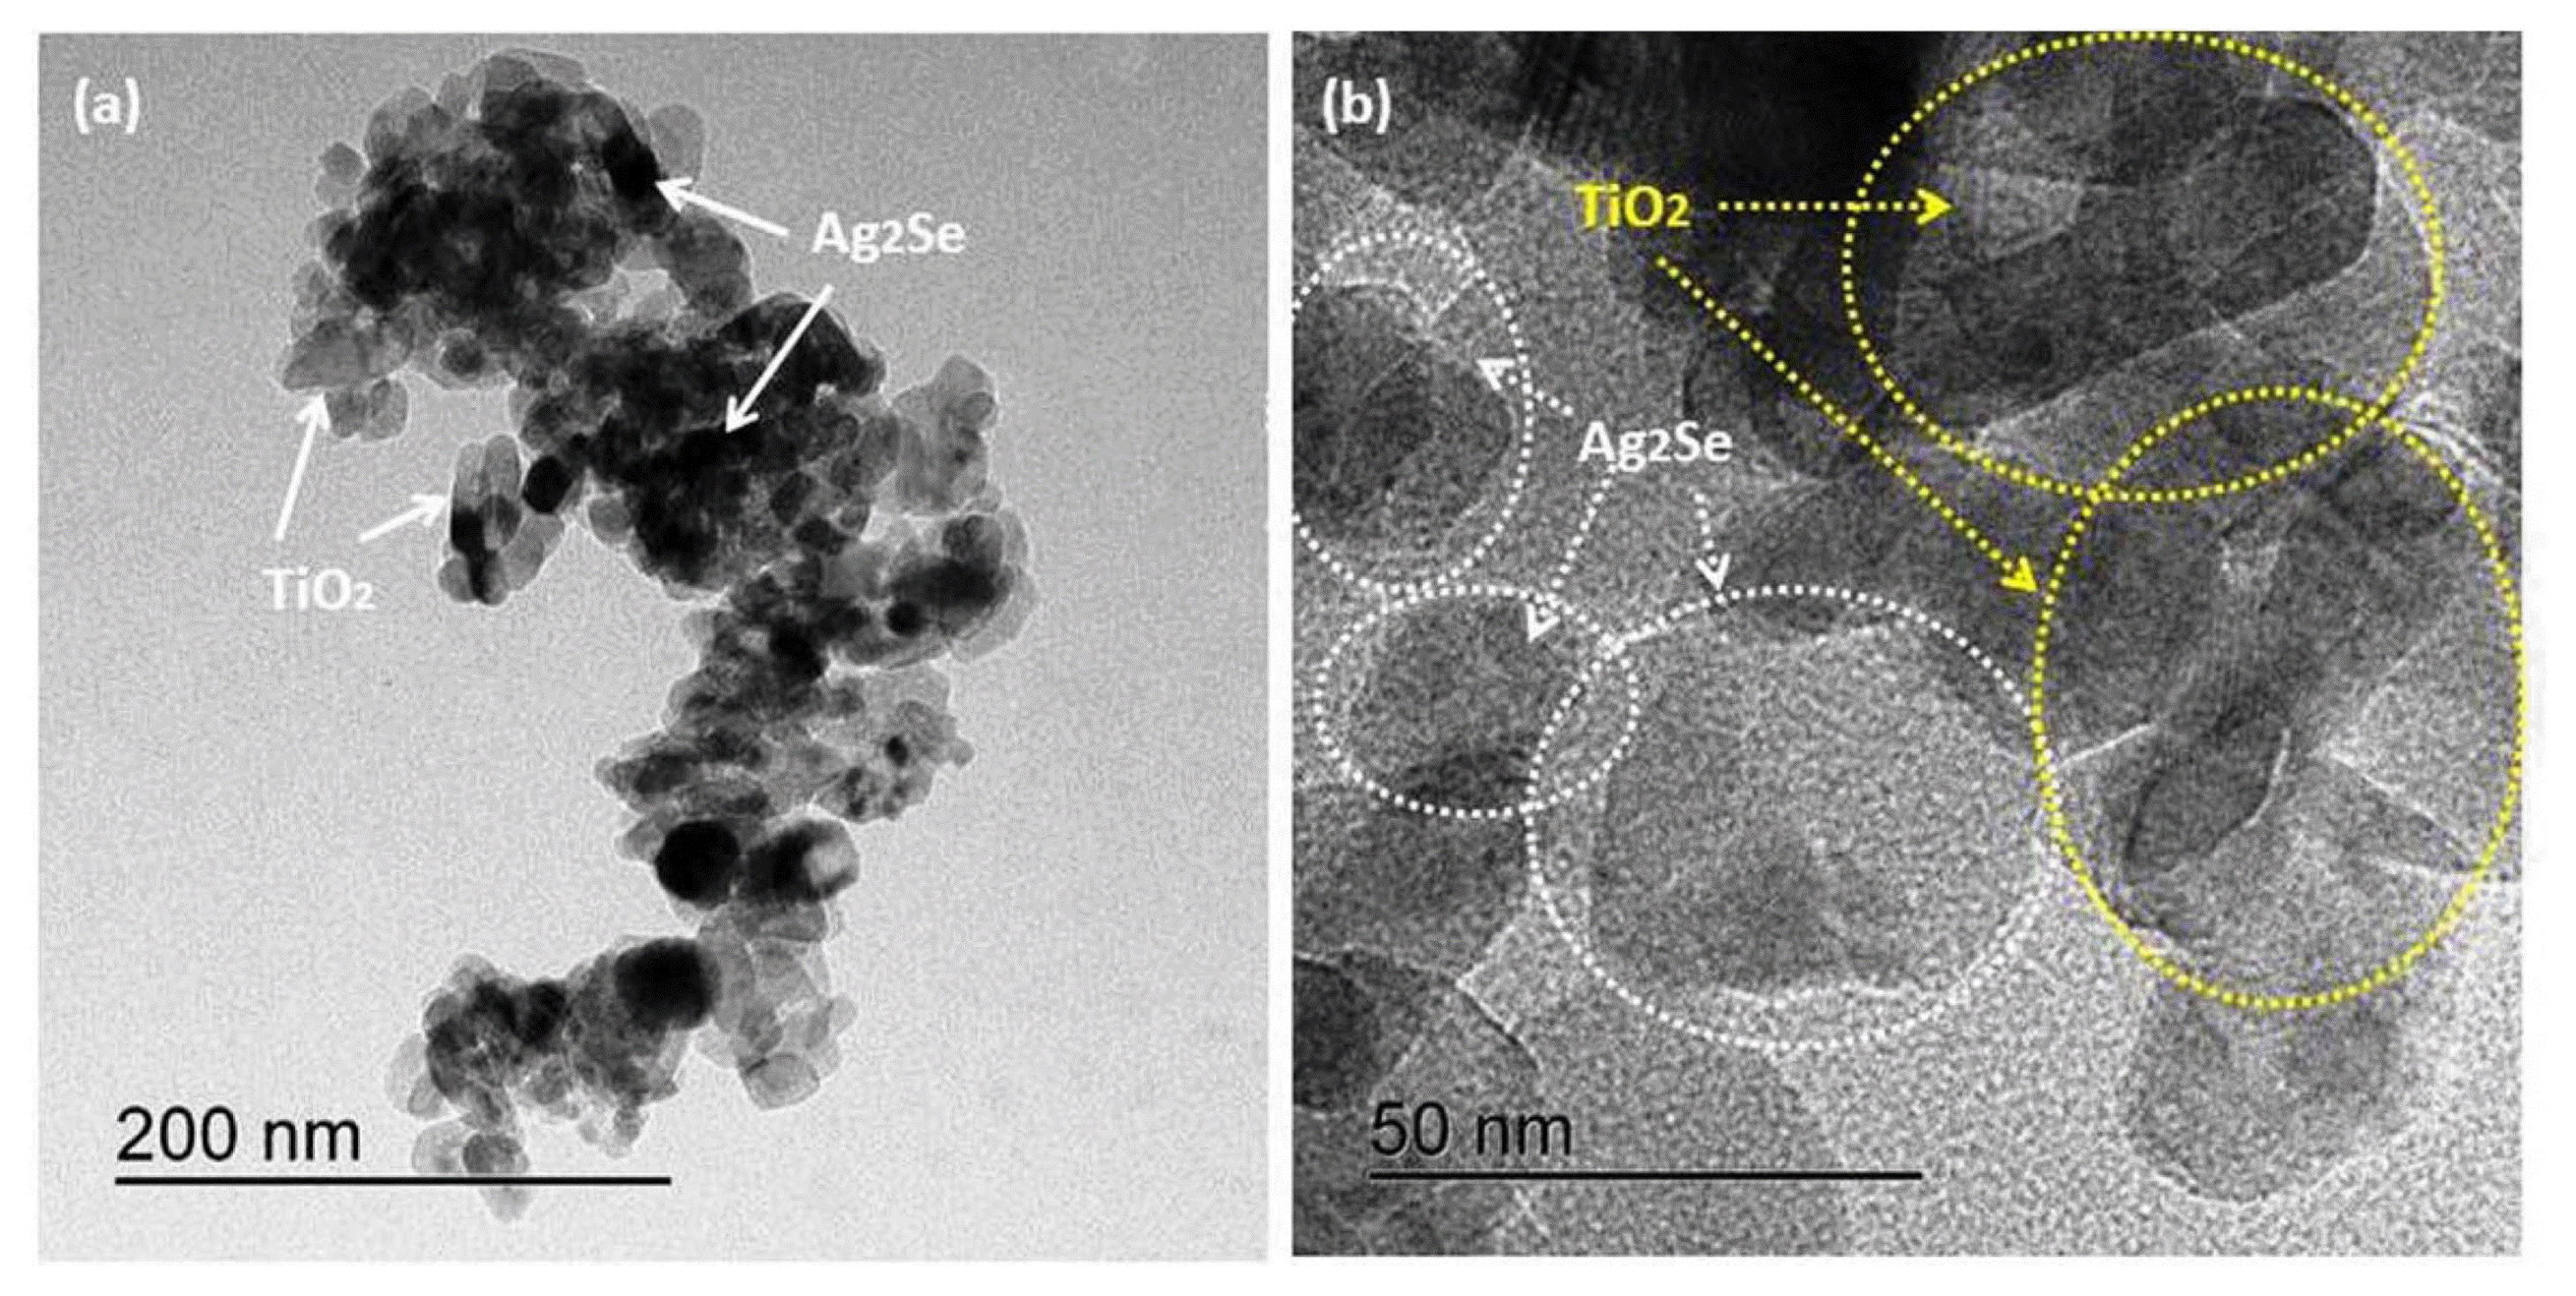
The microstructures of Ag2Se-G-TiO2 can be explored using transmission electron microscopy (TEM). Fig. 4 shows TEM images of the prepared samples with various amplifications. The unpredictable dark images that appear in Figs. 4(a) - 4(b) show that Ag2Se was very agglomerated, while TiO2 nanoparticles were consistently disseminated on the graphene nanosheet, uncovering parts of the Ag2Se connection-like support between the TiO2 and the graphene sheet.32,33) Using image J software, the normal particle size of Ag2Se was found to reach from 15 nm to 25 nm, and that of TiO2 ranges from 13 nm to 33 nm. Hence, the layered Ag2Se supports the TiO2 nanoparticles on the graphene sheet and provides a scaffold between the TiO2 and the graphene nanosheet; we consequently expect that this ultrasonication method is ideal for improving the photocatalytic properties of the Ag2Se-G-TiO2 nanocomposite.34)
Raman spectroscopy can obviously be used to outline the electronic structure of carbon materials and the structural properties of Ag2Se-G-TiO2. Indeed, even a minor change in the band intensity and moving or shifting provide complete details on the carbon-carbon bonds and defects.28) Fig. 5 provides details of the graphene oxide and Ag2Se-G-TiO2 nanocomposites. The characteristic D band shows up at 1354 cm−1, revealing disorder in the atomic arrangement. This gives evidence of the increasing modes of sp3 particles in the carbon and G groups showing up at 1584 cm−1; this provides data on the in-plane vibration of the sp2 bonded carbons.35) The nature of the deformities can be resolved according to the intensity ratio of the D to the G band. The ascertained proportions of the ID and IG bands are roughly 0.06. The intensity ratios of the D and G groups (ID/IG proportion) show that the graphene comprises a few layers, as clarified in the previously mentioned article.36)
3.2. Photocatalytic performance
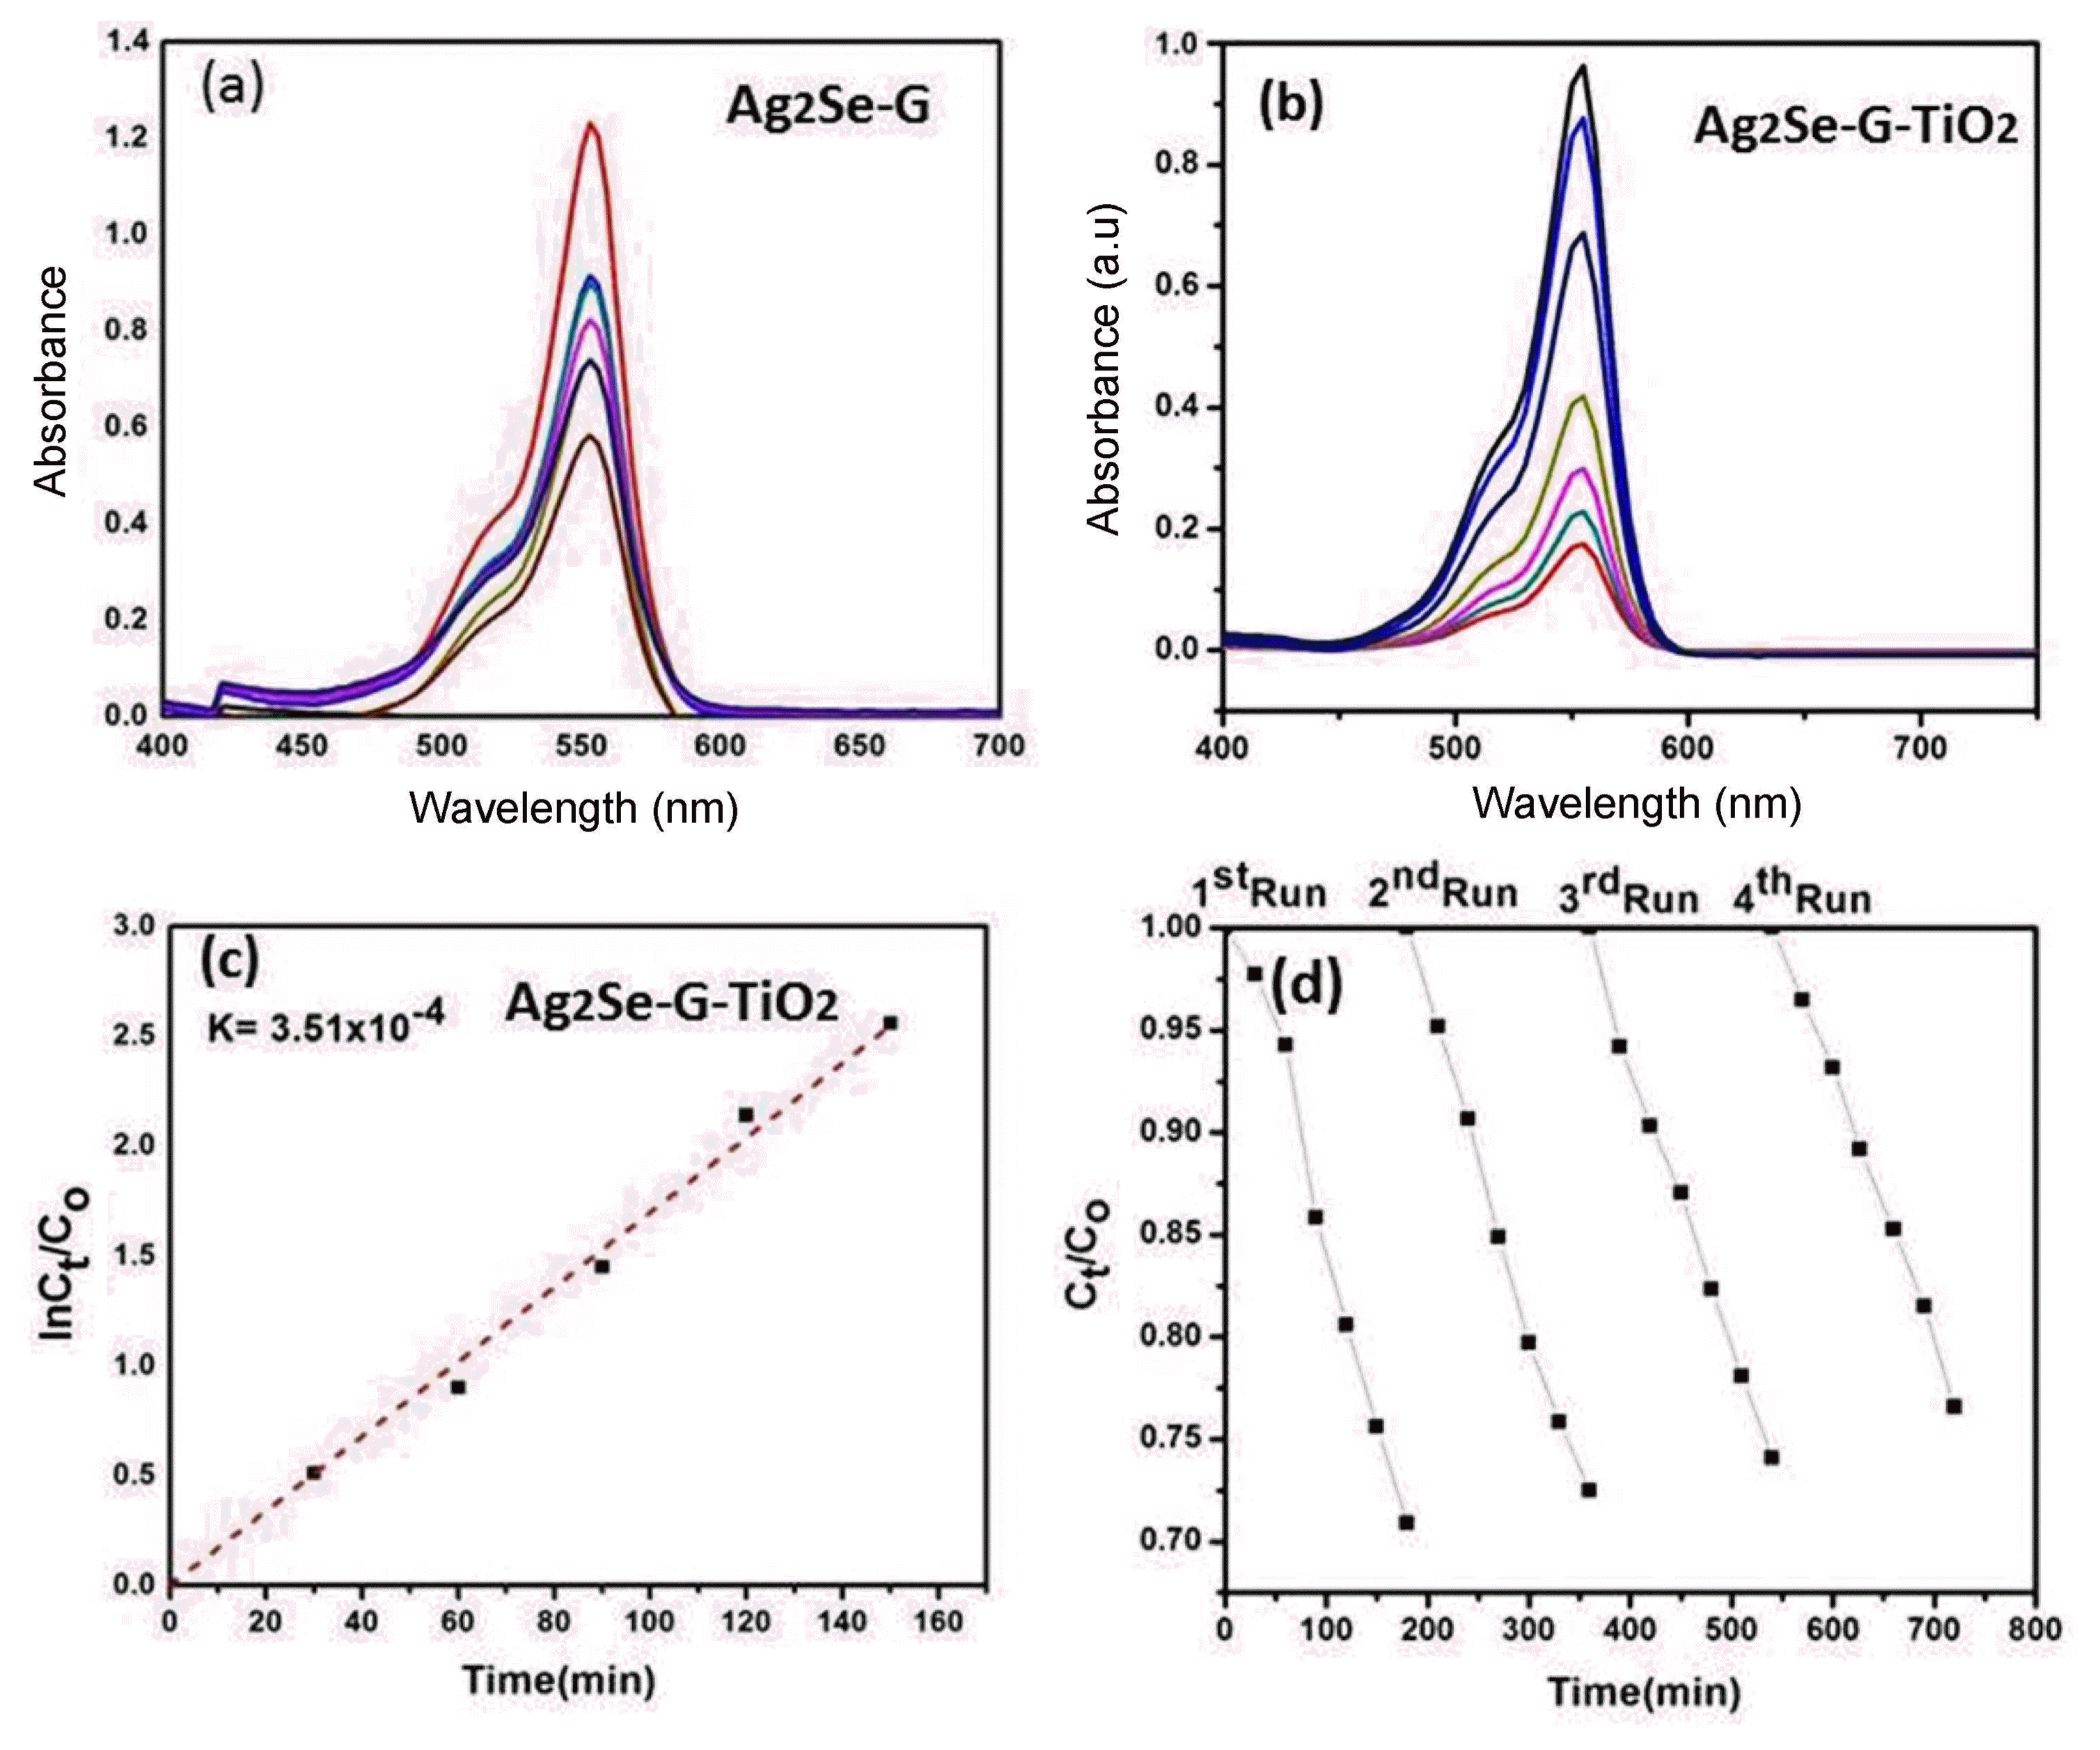
The photocatalytic activity of the Ag2Se-G-TiO2 nanocomposite using RhB as organic dye under visible irradiation was explored and is shown in Fig. 6(a - c). Fig. 6 demonstrates the adsorption capacity of the Ag2Se-G-TiO2 ternary nanocomposite. Fig. 6(a - b) shows the decreasing intensity of the electronic absorption spectra (λmax) at different intervals of time; this decrease gives evidence of the degradation of RhB in the presence of Ag2Se-G-TiO2 catalysts. The λmax estimation of Ag2Se-G-TiO2 was found to be 553 nm; this value dropped by roughly 85.2% toward the finishing time of 180 min. The degradation experiment depends on (1, absorption by the Ag2Se-G-TiO2 photocatalyst, (2 quick charge exchange route and (3 graphene, initially in two stages, deteriorates the organic pollutants. While graphene acts as an adsorption support material and dye absorbs molecules on the surface of graphene by means of π-π collaboration, Fig. 6(b) shows that the convergence of RhB changes with the different intervals of time, which shows the good absorption efficiency of RhB of the Ag2Se-G-TiO2 nanocomposites. To achieve adsorption-desorption equilibrium, the prepared sample was kept in the dark for 2 h after the adsorption-desorption balance had been reached; the solution was kept in a shut box and visible light was turned on. The arrangement was lighted for 30 min; each 30 min test was pulled out of the chamber for further amalgamation. After 30 min, the sample was withdrawn and centrifuged and the dye concentration was determined using a UV-visible spectrometer. Fig. 6(b) demonstrates that the photocatalytic degradation performance of Ag2Se-G-TiO2 nanocomposites is higher than that of Ag2Se-G. During the increasing of the time, the intensity of the characteristic absorption band of Rh B (553 nm) was found to significantly decrease and, after 180 min, approximately 85.2% of the organic dye was degraded. Furthermore, the kinetics of the degradation can be expressed as −In(Ct/Co) = Kappt, where Kappt is the apparent rate constant, CO is the initial concentration at t = 0 and Ct is the concentration of dye at t = t.37) The kinetic plot and the apparent rate constant (Kaap) (slope of the) are shown in Fig. 6(c). To examine the stability and reusability of the Ag2Se-G-TiO2 composites, the cycle was kept running during the photocatalytic degradation of Rh.B in the presence of Ag2Se-G-TiO2 under visible light. Fig. 6(d) demonstrates that Ag2Se-G-TiO2 saw a minor reduction in the initial two cycles of the photodegradation of Rh. B. The decay rates for the first, second, third and fourth cycles were 18.62, 18.10, 17.23 and 15.33%, separately. These results show that the Ag2Se-G-TiO2 has great stability. It appears to be an encouraging candidate for use in natural purification.
4. Conclusions
In summary, Ag2Se-G-TiO2 was formed by means of an ultrasonic procedure. SEM and TEM images clearly show that the Ag2Se was consistently scattered on the graphene sheets. The point by point examination uncovered that Ag2Se-G-TiO2 is a successful catalyst for photodegradation, in contrast with immaculate the TiO2/Ag2Se-G binary nanocomposite. Besides this, graphene acts an adsorption support material, cooperating with the composite and the dye molecules on the surface of graphene. The present work has opened a new path for the utilization of graphene based materials to grow uncommonly effective ternary frameworks for photocatalytic degradation of organic dyes.


