


1. Introduction
Gd-doped CeO2 (GDC) has been attracting wide attention as a candidate electrolyte for solid oxide fuel cells (SOFC) due to its high oxygen-ionic conductivity and good compatibility with electrodes.1-3) The important issues for electrolyte materials are developing a solid electrolyte material with higher ion conductivity and lowering the sintering temperature. It is natural that high ionic conductivity can be achieved, as more Gd is doped in CeO2, because Gd3+ incorporation in CeO2 produces oxygen vacancies. However, it remains difficult for the GDC electrolytes to be densely sintered below 1500°C when using the solid state reaction method. Because a high sintering temperature may lead to uncontrollable chemical reactions between cell components, and also a partial reduction from Ce4+ to Ce3+ ions,4) low temperature sintering has been a challenge to researchers.
Another issue is adhesion between the layers in multilayer structured SOFCs. To achieve excellent cell performance, complete adhesion between two materials, different with respect to physical and chemical properties, is very important. For better adhesion and higher quality contacts, many researchers concentrated on materials selection, cell structure control, and studies of new manufacturing processes.
It has recently been reported that the addition of a small amount of transition metal ions such as MnO2, Fe2O3, CuO, and CoO effectively promotes sintering of CeO2.5,6) In the case of Mn4+, Fe3+, and Co2+, it has been reported that the doping changes the early-stage sintering mechanism of CeO2 7,8) via enhanced grain boundary mobility due to the large distortion of the surrounding lattice because those ions have much smaller ionic sizes than that of Ce4+, which facilitated defect migration of CeO2.7) Particularly, the effect of cobalt addition on improved densification and electrical conductivity has been investigated in many previous studies. 9-14)
On the other hand, the enhanced densification of CeO2 can be explained as a product of the liquid phase sintering mechanism.15) Han et al. observed a very thin amorphous oxide grain boundary layer and the sintering temperature could be decreased to 950°C,16) whereas Fu et al. asserted that the addition of Mn, Fe, Cu, and Li lead to viscous flow sintering of CeO2.17) On the other hand, no evidence of eutectic liquid phase sintering was found in the CoO-CeO2 system. 7) Although SOFCs are multilayer ceramic devices, the effects of the transition metal ions as a sintering aid on adhesion characteristics have not yet been studied.
In this study, a small amount of CoO (1 and 2 at.%) was added to the commercial GDC powder and sintered at 1,000 to 1,300°C for 2 h. The effects of Co-doping on densification of GDC and adhesion characteristics of the GDC/8YSZ bilayers were examined. SEM, TEM, and complex impedance spectroscopy studies were carried out for characterization.
2. Experimental Procedure
Raw powders of commercial (Ce0.9Gd0.1)O2 (Grand Chemical & Material Co., Ltd., 99.9%, Korea) and Co3O4 (High Purity Chemicals, 99.9%, Japan) were used as the starting materials. A suitable amount of Co3O4 was added to the commercial GDC to form the compositions of [(Ce0.9Gd0.1)1−xCox]O2 where x = 0, 0.01, 0.02. The weighed powders were wetmixed for 24 h in a plastic jar with zirconia balls and ethanol. After drying, the powders were formed into pellets by cold isostatic pressing (CIP) at 100 MPa. The pellets were sintered in the temperature range of 1,000 to 1,300°C for 2 h in air with a heating rate of 5°C/min then followed by furnace cooling. Crystal structures of the sintered samples were identified by an X-ray diffractometer (Mac Science, MO3XHF, Japan) using Cu-Kα radiation. The density of the sintered samples was measured by the Archimedes method. Densification behavior of the samples was monitored using a thermo-mechanical analyzer (TMA; TD5000SA, Bruker, Germany). The microstructures of the samples were observed using a field emission scanning electron microscope (FESEM; JEOL, JSM-6701F, Japan).
TEM observations of the samples sintered at 1,200°C for 2 h were performed using a field-emission gun operating at 200 kV (Tecnai G2 F20 S-TWIN). The electrical characteristics of the sample were analyzed in the temperature range of 100 to 600°C using an AC impedance measurement system (VersaSTAT3, Princeton Applied Research, USA). Platinum electrodes were applied to the surfaces of polished samples and annealed at 1,000°C. To evaluate the adhesion characteristics of GDC on the 8YSZ anode, GDC/8YSZ and 1 at.% Co-doped GDC/8YSZ bilayers were fabricated. The 8YSZ-NiO anode was made by an extrusion process and pre-sintered at 1,000°C for 1 h. The 8YSZ layer with a thickness of approximately 6 to 7 μm was formed through the dip coating process on the anode. Then, the GDC and Co-doped GDC layers were prepared using a screen printing technique. The bilayers were slowly heated to 1,000°C then sintered at 1,260°C for 2 h.
3. Results and Discussion
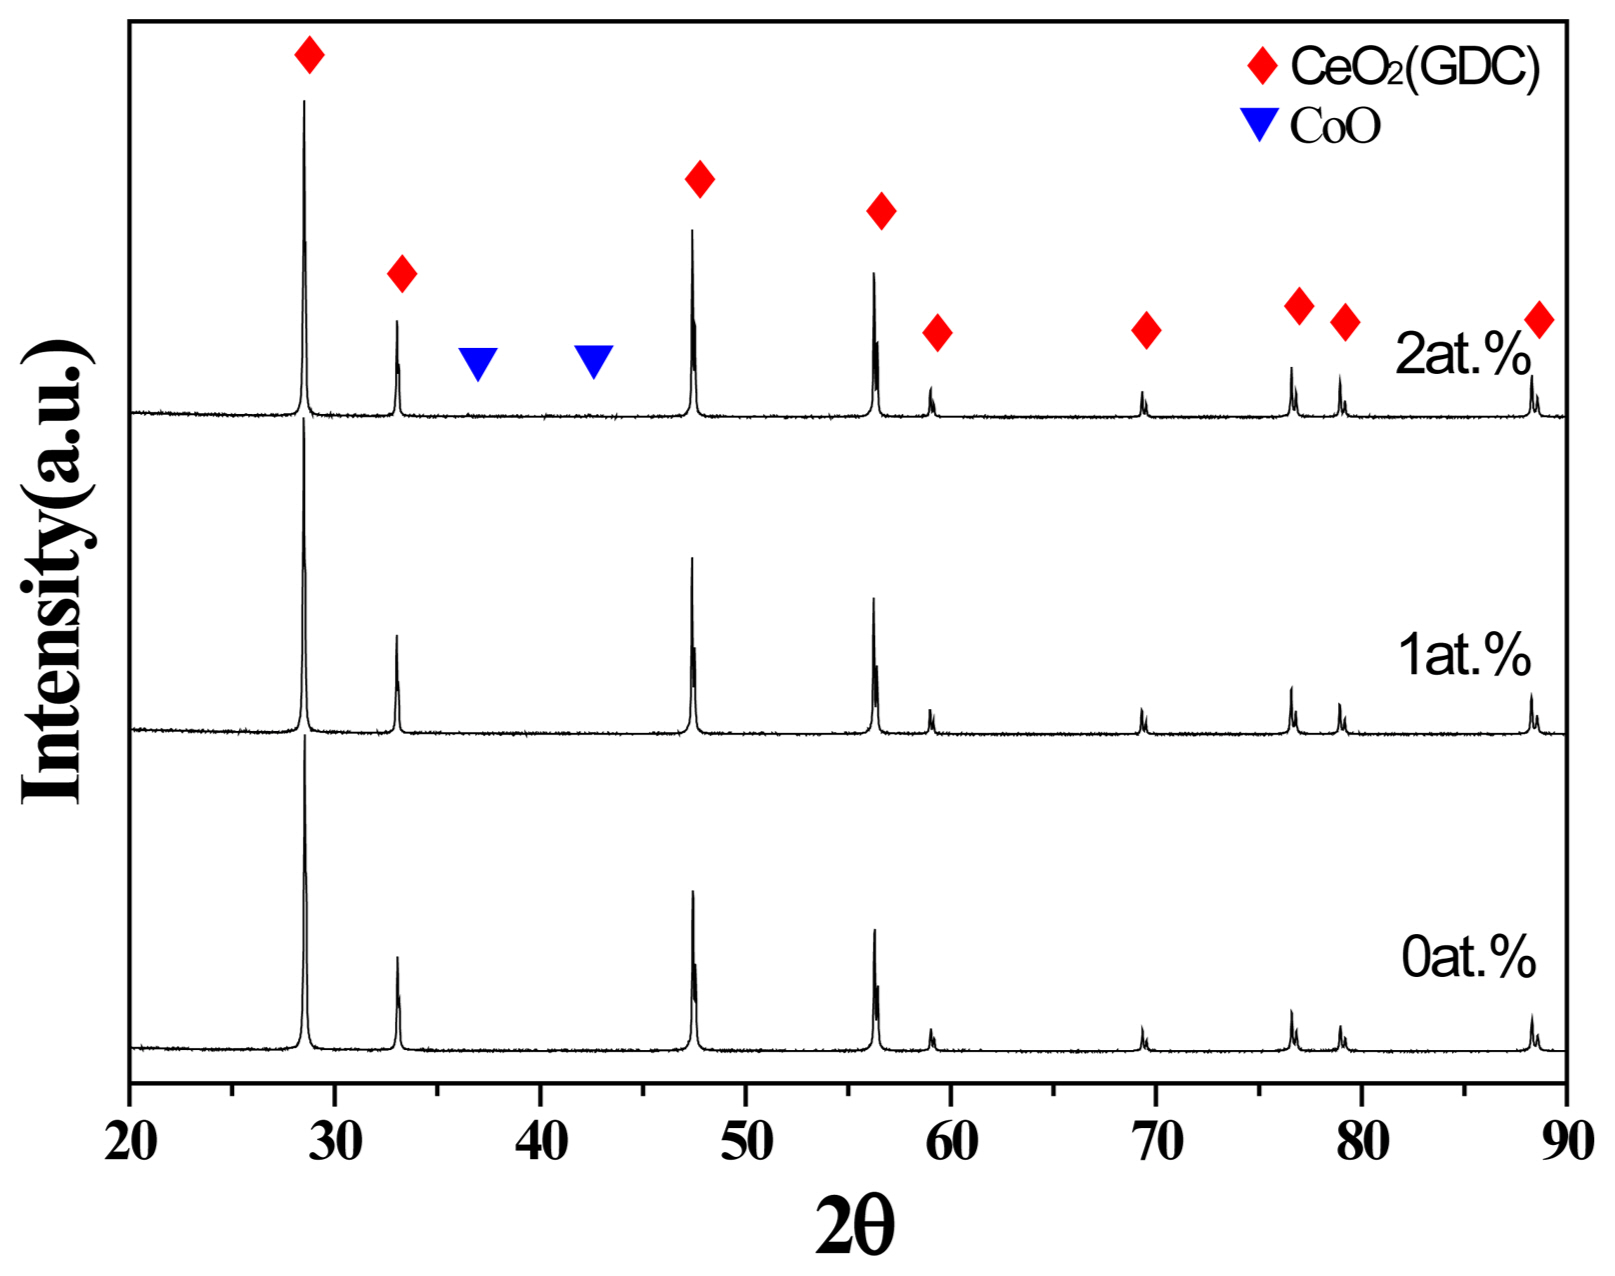
X-ray diffraction patterns of the samples sintered at 1,200 °C for 2 h as a function of Co content in [(Ce0.9Gd0.1)1−xCox]O2 where x = 0, 0.01, 0.02 at.% are presented in Fig. 1. In the composition with 1 at.% Co, only the diffraction peaks from GDC appeared. This result can be attributed to the fact that all Co is soluble in GDC and forms a single phase. The second phase of CoO was seen in the sample containing 2 at.% Co. This result indicates that the solubility limit of Co in (Ce0.9Gd0.1)O2 is below 2 at.%. Therefore, the composition over the solubility limit (2 at.% Co) will not be considered hereafter.
On the basis of the X-ray diffraction results in Fig. 1, the lattice constants of the GDC and 1 at.% Co-doped GDC were calculated. The results showed that the lattice constants were 5.417(4) Å and 5.419(4) Å for GDC and 1 at.% Co-doped GDC, respectively. Assuming that 1 at.% Co substitutes for Ce4+ in the fluorite-structured CeO2, a decrease in the lattice constant is anticipated, because the ionic radius of Co2+ (0.55 Å) is smaller than that of both Ce4+ (0.97 Å) and Gd3+ (1.05 Å). When Co2+ ions substitute for Ce4+ in CeO2, oxygen vacancies will be generated for charge compensation. In this case, the additional oxygen vacancies in the structure will reduce the shielding effect, which will lead to an increase in the average cation-cation distances.18) Accordingly, the increased lattice constant based on the Co doping is thought to be caused by a reduction in the shielding effect in the crystal. This kind of lattice expansion is reported in Sn-doped In2O3 (ITO)19) and reduced CeO2−x.20)
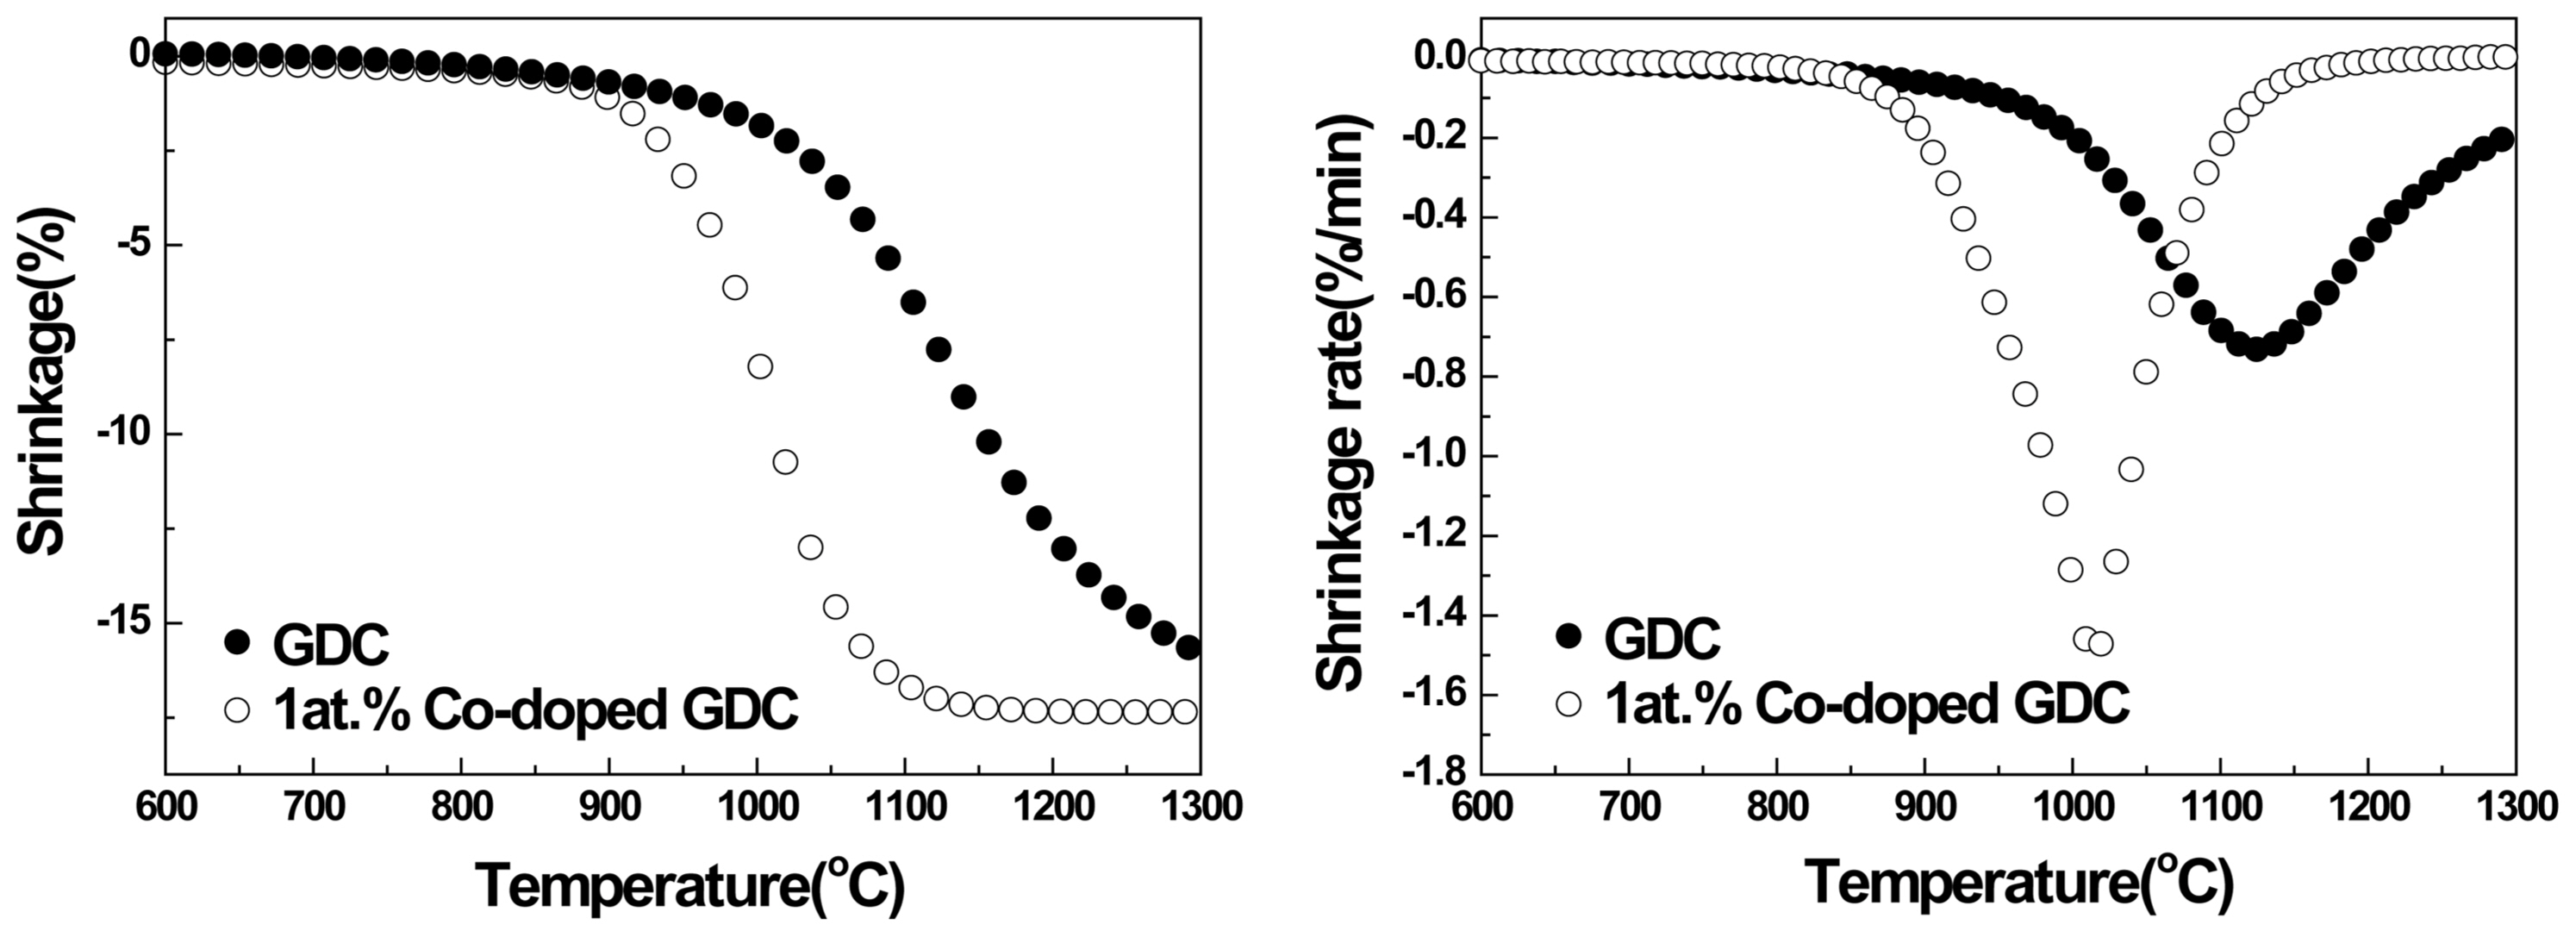
Figure 2(a) shows the result of a thermo-mechanical analysis (TMA) of the GDC and 1 at.% Co-doped GDC samples. Shrinkage during sintering was measured from room temperature to 1,300°C with a heating rate of 10°C/min in air. Fig. 2(b) shows the shrinkage rate of the samples calculated from the linear shrinkage. Fig. 2(a) shows that the temperature at which densification begins is shifted to a lower temperature of approximately 900°C when a small amount of Co is added. The densification process for the sample with 1 at.% Co ends at approximately 1,100°C, whereas that of the pure GDC continues, even up to 1,300°C. Fig. 2(b) also shows the decrease of the temperature at which the maximum shrinkage rate appeared; the temperature decreased significantly near 1,000°C when 1 at.% Co is doped.
Figure 3 shows the relative density of the samples after sintering at each temperature for 2 h. In the case of the low sintering temperature of 1,000°C, high densification of over 98% was obtained when Co was doped. However, the density slowly decreased as the sintering temperature increased further, probably because of the overfiring (oversintering) phenomenon.21-23) When the samples are sintered above the optimum sintering temperature at which maximum densification was attained, porosity increased as the grain size increased, which resulted in the density and strength of the samples decreasing. On the other hand, when Co was absent, the density barely reached approximately 68% at 1,000°C, then steadily increased to 92% at 1,300°C as the sintering temperature increased.
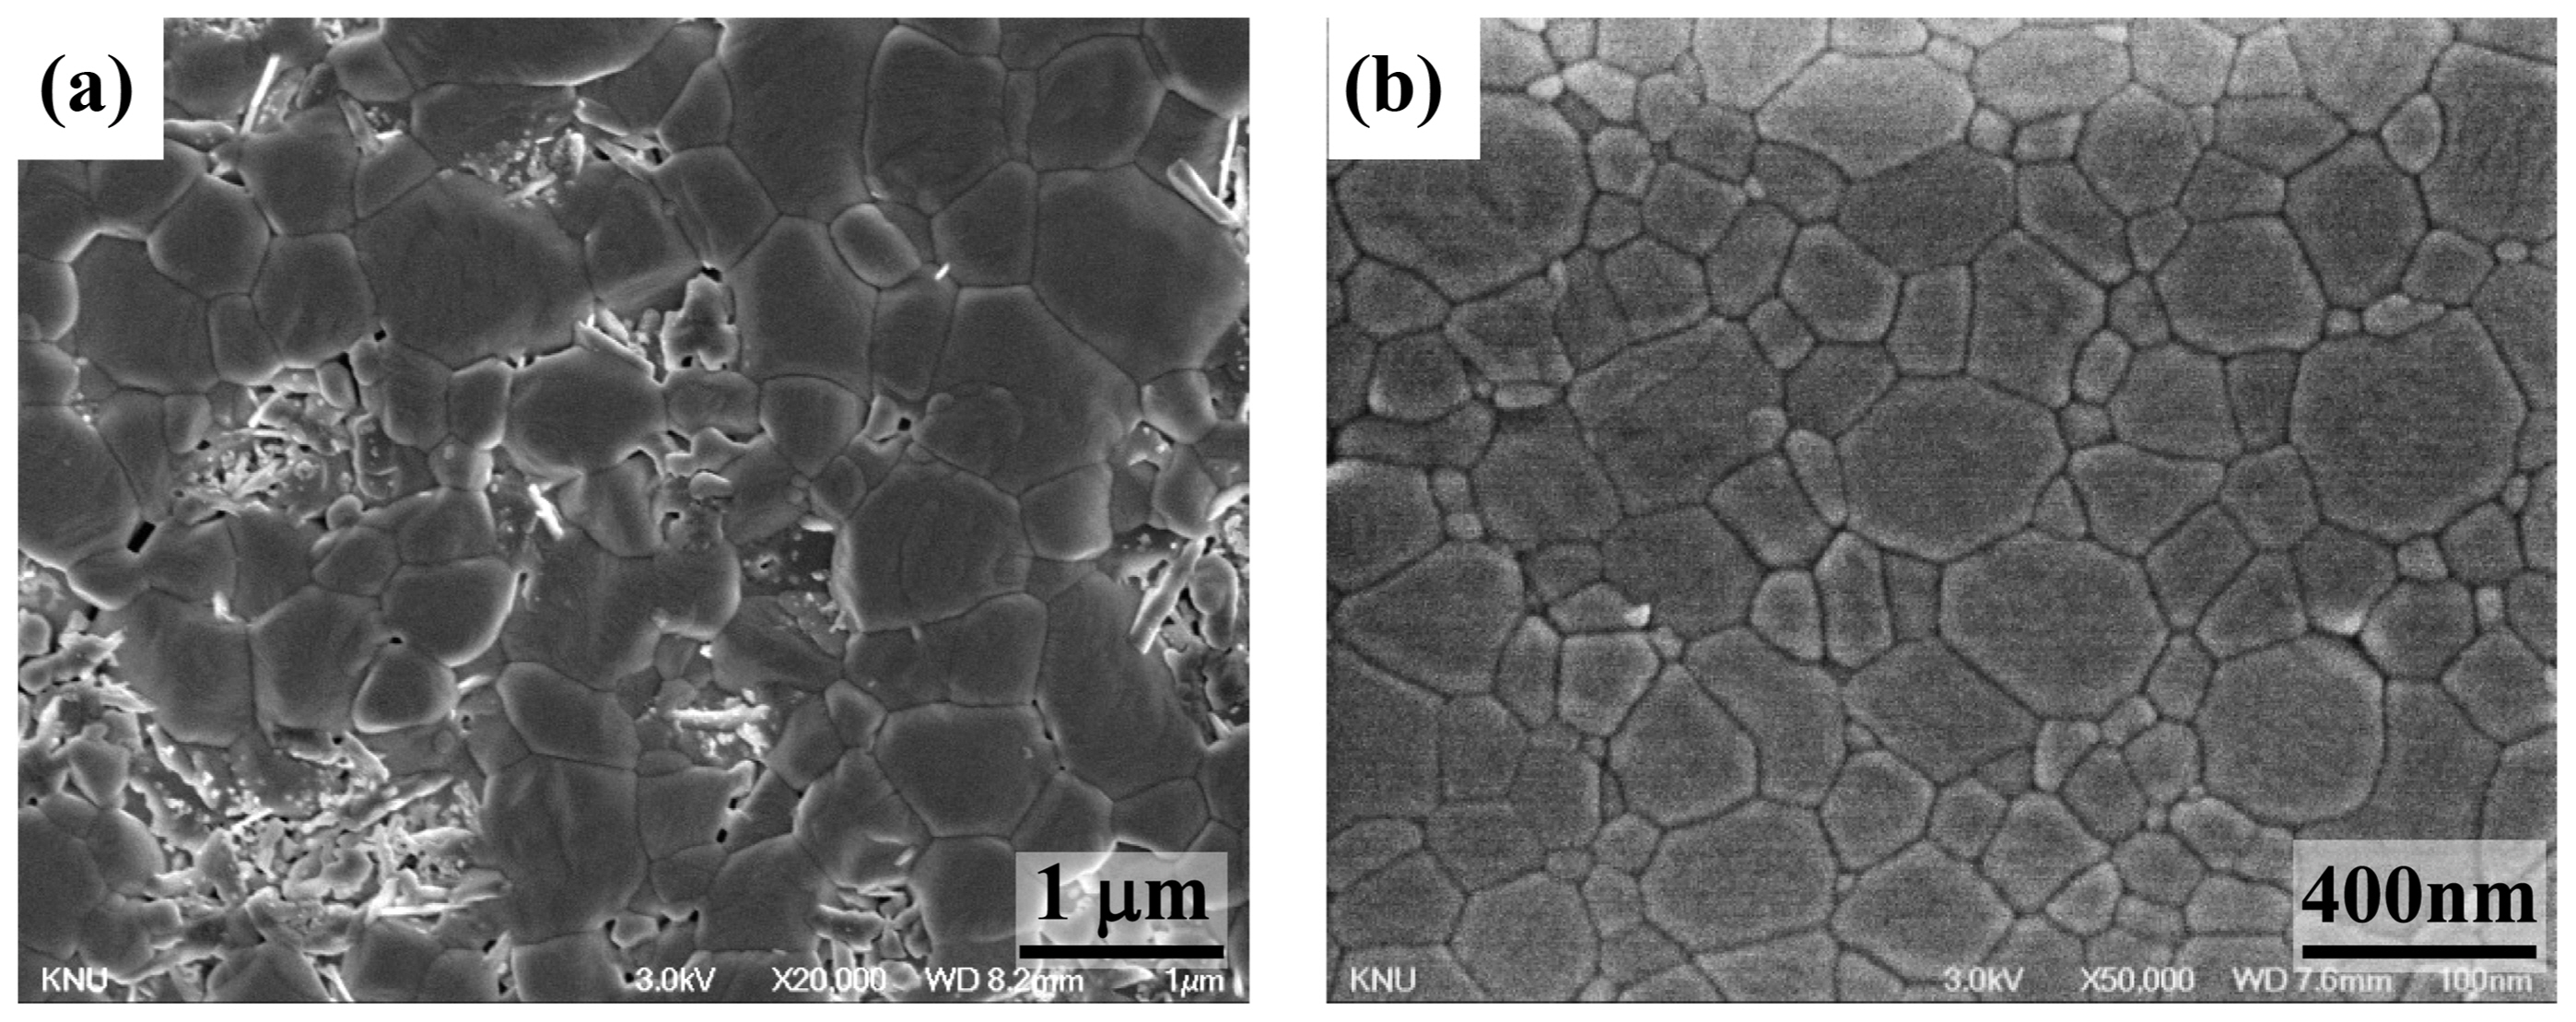
A comparison of the microstructures for (a) the GDC sample sintered at 1,300°C for 2 h, and (b) the 1 at.% Co-doped GDC sample sintered at 1,000°C for 2 h is presented in Fig. 4. In the case of (a), although the sample was sintered at a high temperature of 1,300°C, some pores were observed in the sample and the microstructure was inhomogeneous (containing large and small grains). On the other hand, in spite of the low sintering temperature of 1,000°C, a highly densified microstructure was observed in samples when 1 at.% Co was doped.
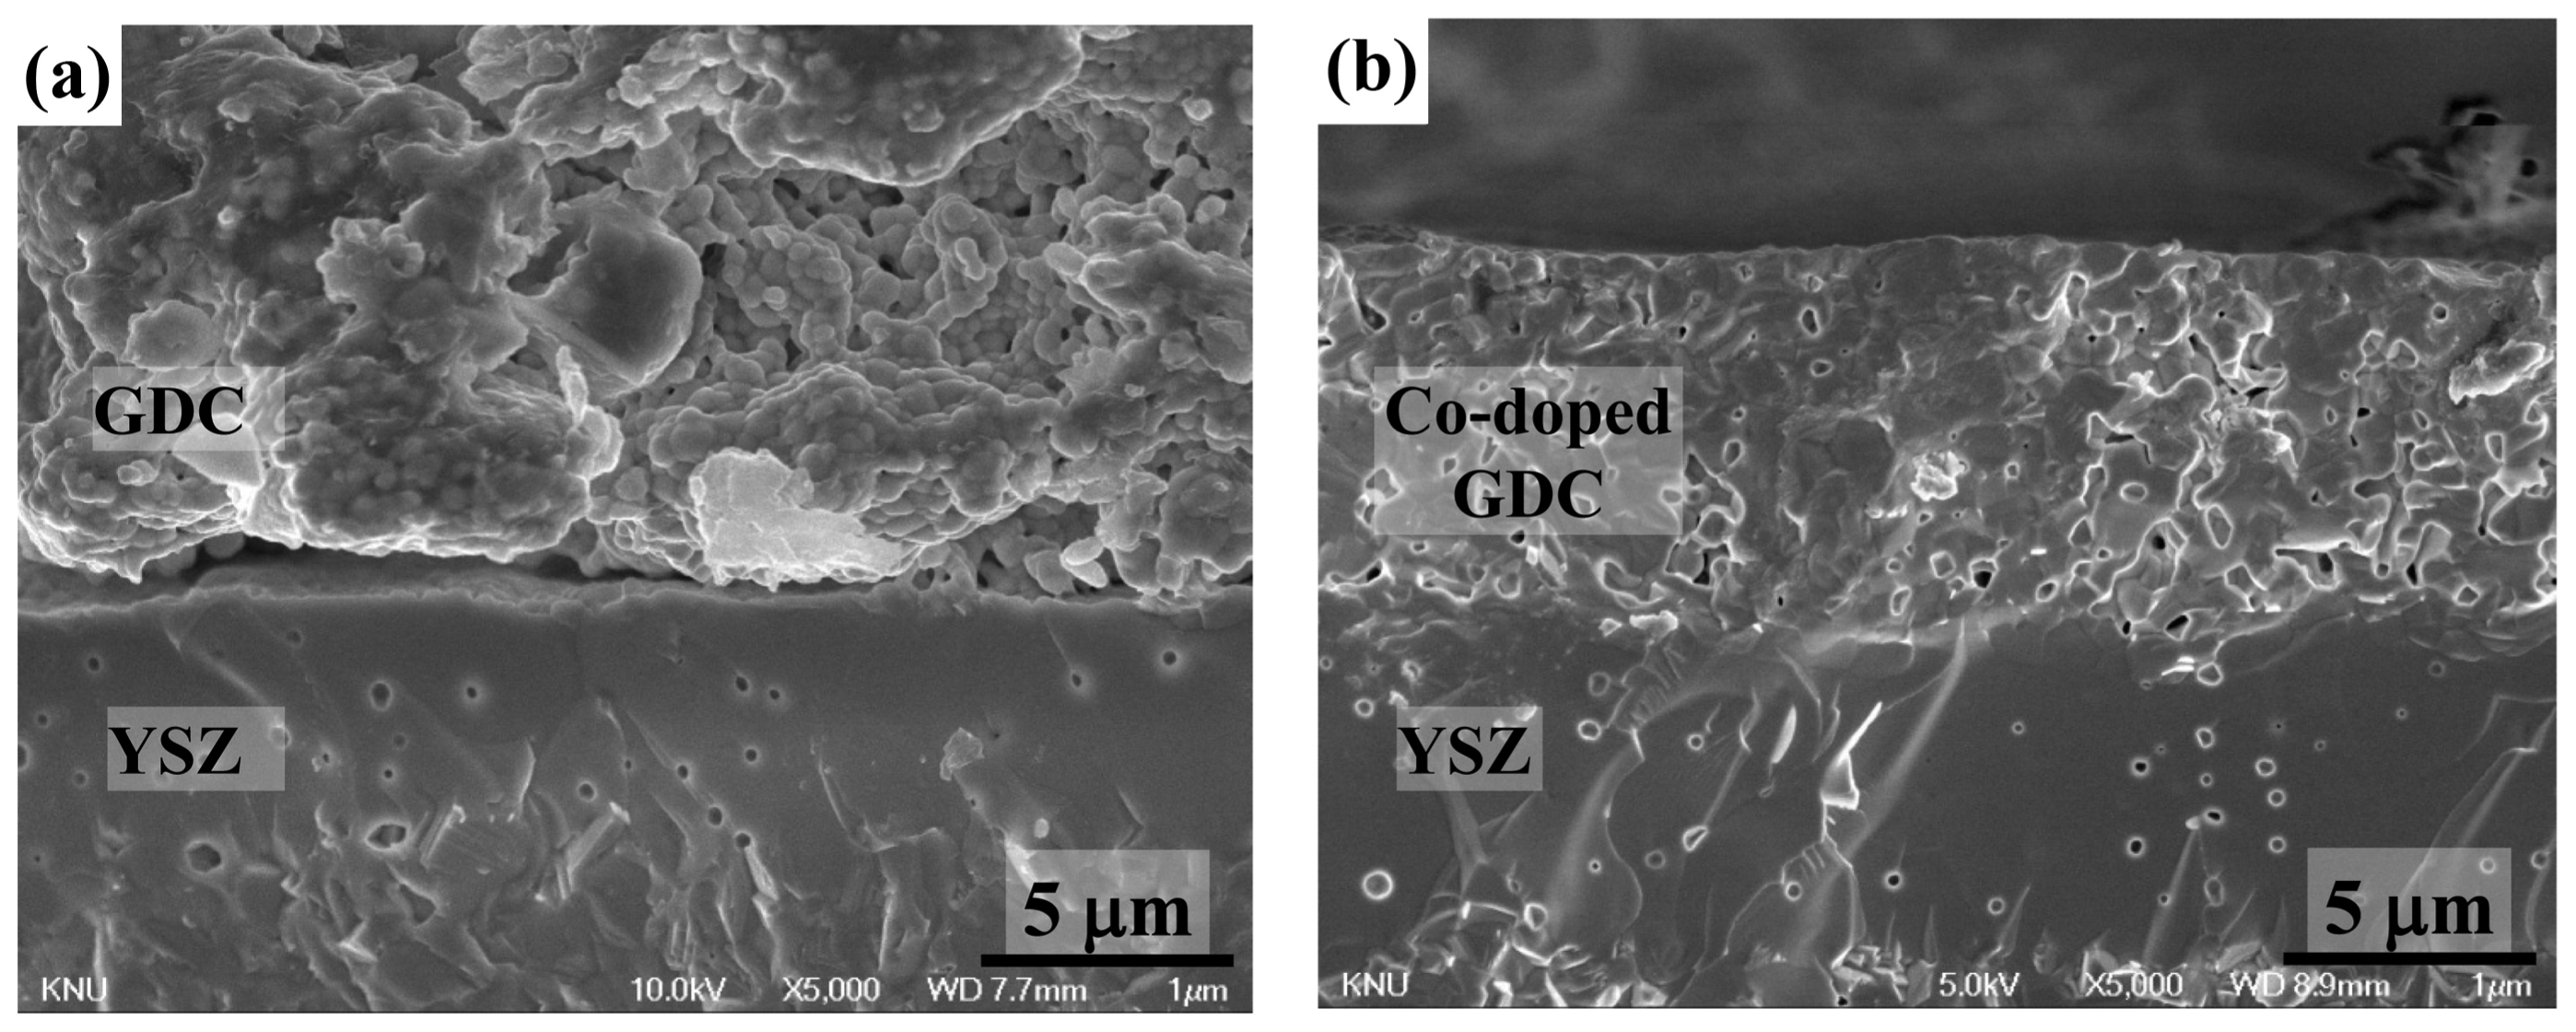
Figure 5 shows the SEM micrographs of the cross-section of the anode-supported bilayers between 8YSZ and GDC, which was sintered at 1,260°C for 2 h. Fig. 5(a) shows the GDC/8YSZ bilayer and (b) shows the 1 at.% Co-doped GDC/8YSZ bilayer. It can be seen that the 8YSZ electrolyte layer is well densified, despite having several closed pores. In the case of (a), the GDC layer is not well densified and the layer is not firmly attached to the 8YSZ. However, the Co-doped GDC layer in (b) has a denser microstructure than the GDC layer in (a), and the Co-doped GDC layer showed good attachment with the 8YSZ, although the interface is formed by different materials. The enhanced densification (mass flow) due to the addition of Co resulted in complete adhesion.
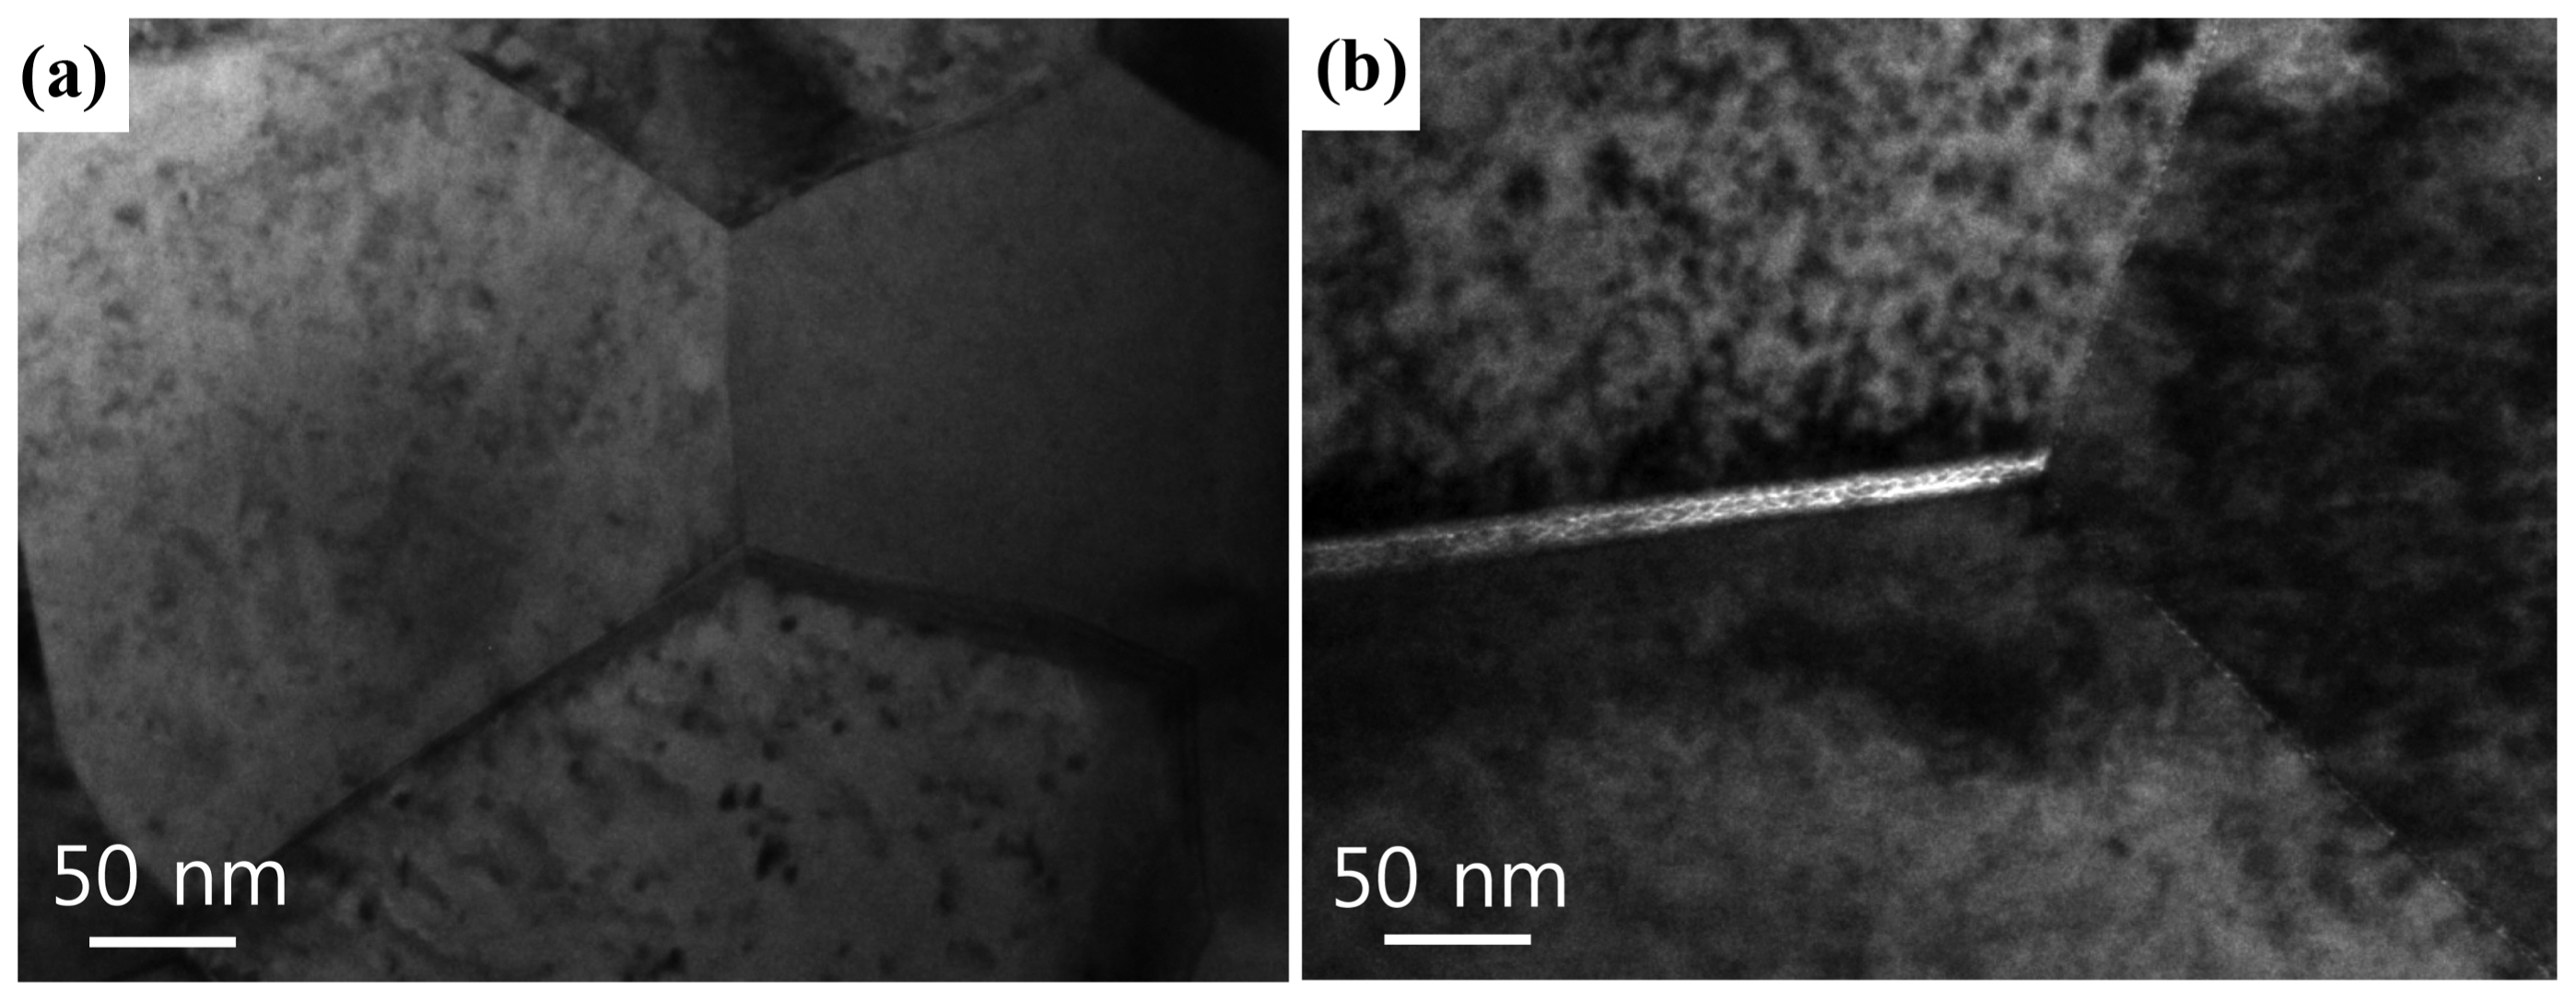
TEM images of the triple grain junction regions of the GDC and 1 at.% Co-doped GDC samples sintered at 1,200°C for 2 h are presented in Fig. 6. It is known that a siliceous impurity, even a trace amount, causes highly resistive inter-granular segregation or secondary phases in fluorite-structured solid electrolytes, such as acceptor-doped ceria.24-26) However, in the case of the GDC [Fig. 6(a)], the grain boundaries were clean, and no traces of the liquid films at the grain boundaries were observed in the microstructure. In the case of the 1 at.% Co-doped GDC [Fig. 6(b)], liquid films were observed in the microstructure along the grain boundaries with a thickness of approximately 10 nm. Although the liquid film is very thin, it provides a faster diffusion path and accelerates densification. Moreover, because liquid films facilitate particle rearrangement and migration during sintering, mechanical stresses at the interface of the bilayer that develop because of different densification rates between the layers can be reduced.27,28) Therefore, the liquid films in the Co-doped GDC are thought to contribute to densification and good adhesion.
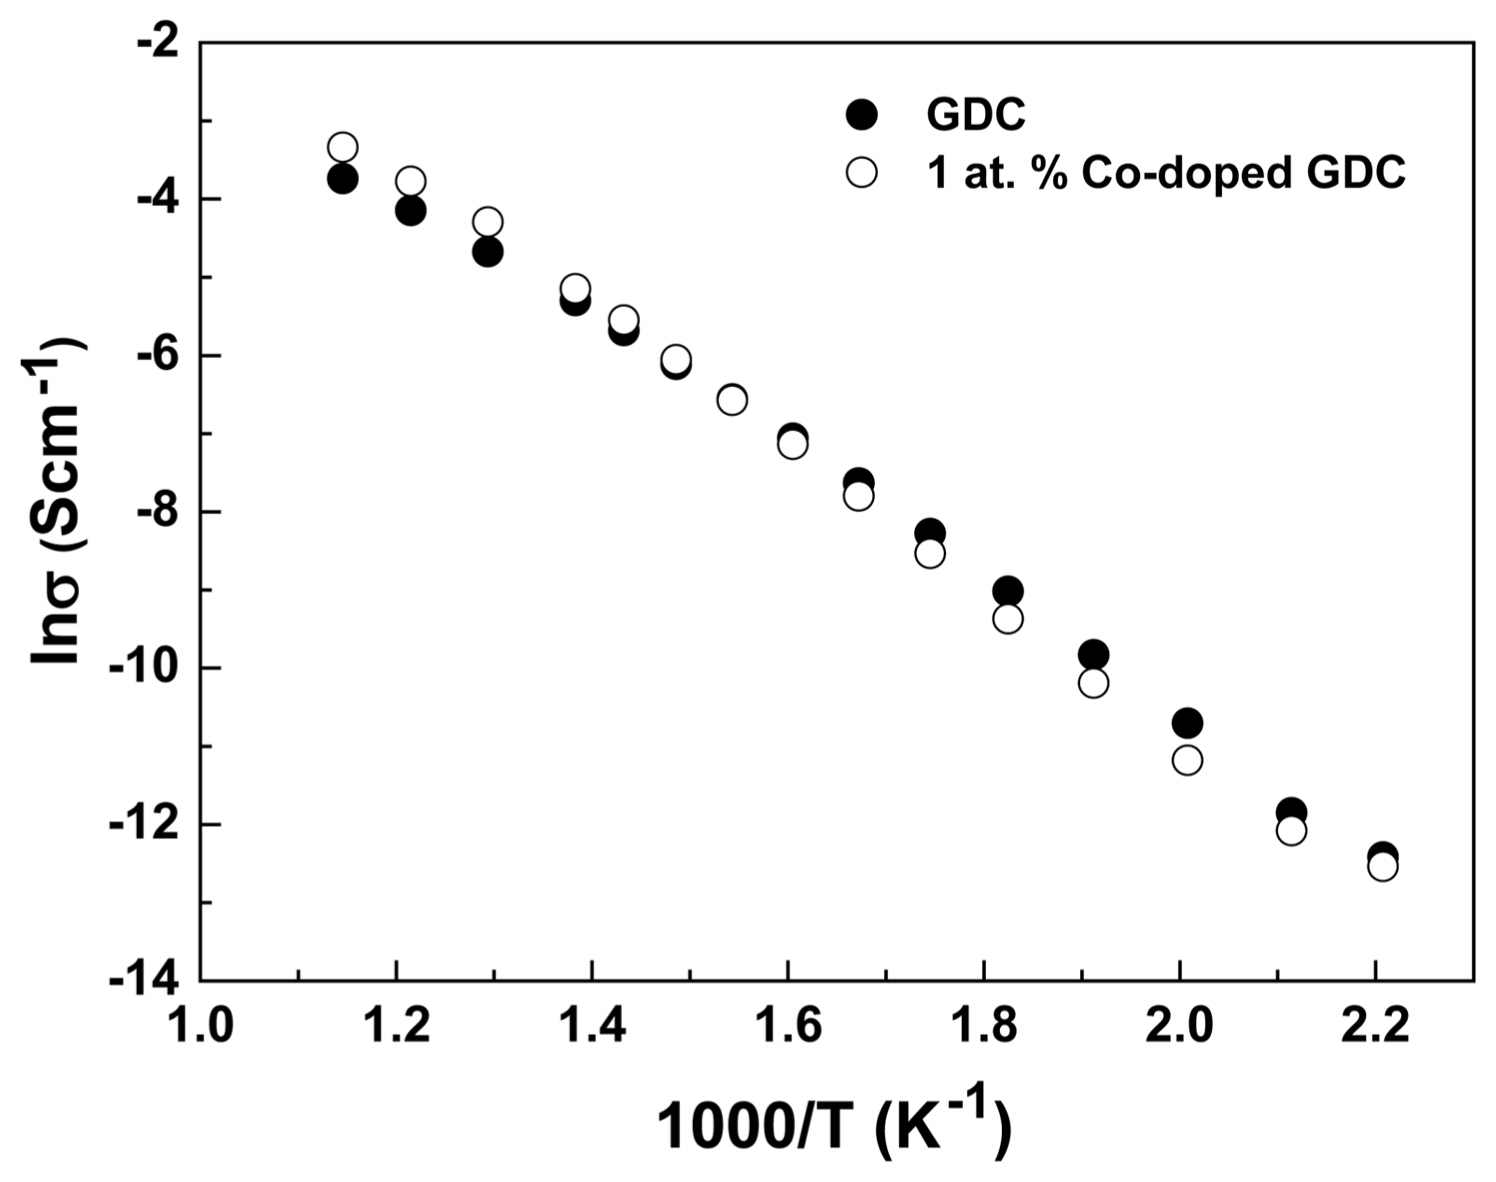
The electrical characteristics of the GDC and 1 at.% Co-doped GDC are presented in Fig. 7. The conductivity values of the samples were almost the same throughout the temperature range analyzed. When Co2+ is doped in GDC, an increase in the electrical conductivity due to the increased oxygen vacancy was expected. However, no significant effect of Co2+ doping was observed. It is reported that the migration and defect association energy in the grain interior and at the grain boundary affect the electrical conductivity of GDCs.29,30) Therefore, the lattice constant and grain boundary segregation in doped GDC are thought to play important roles in the conductivity of the samples. Previous studies have also reported that Co-doping has a minor effect on the electrical conductivity of GDC.29)
4. Conclusions
The small amount of Co-doping in (Ce0.9Gd0.1)O2 dramatically enhanced low temperature densification. A TEM study of the grain boundaries of the Co-doped GDC revealed that liquid films play an important role in stress reduction at the interface during sintering. As a result, the liquid films in the Co-doped GDC contributed to good adhesion with the YSZ electrolyte. The total conductivity values of the GDC and 1 at.% Co-doped GDC samples were almost the same within the temperature range analyzed.