1. Introduction
Quartz glass, having a very low metal impurity content, is a material that has excellent chemical stability, ultraviolet ray transmittance, and thermal resistance. Therefore, quartz glass is widely used in the high-tech industry in precision optical materials such as ultra-violet protection lenses, prisms, mirrors, and filters, for semiconductor process parts including baths, chambers, boats and photomask substrates, and as a target material for liquid crystal displays (LCD), LCD photomask substrates, high-temperature poly-Si TFT LCD substrates, and optical fibers for information technology.1)
The raw material for quartz glass is SiO2 powder. Various heat sources, such as oxy-hydrogen flame, electric resistors, and plasma may be used for melting. The melting requires a high temperature of over 1800°C; the bubbles generated in the melting process are difficult to remove due to the high viscosity of the melt material.
The bubbles remaining in quartz glass cause decreases in the optical, electrical, and mechanical properties, such as the light transmittance, withstanding voltage, and strength. Particularly in the semiconductor plasma etching process, such bubbles may induce plasma arcing, which may result in particle contamination. Therefore, removal of the bubbles is critical.2,3)
According to R. H. Doremus, bubbles are formed as O2 and N2 in the air, or CO2 discharged by the degradation of the raw material, are trapped in the glass melting process. As described above, due to the high viscosity of quartz glass, bubbles are formed during cooling after the melting of the raw material, as O2 generated by the pyrolysis of air included in the raw material (bubbles between powder particles) and when SiO2, CO, and CO2 generated by the reaction of SiO or of a graphite mold (sheet) are not removed but trapped in the quartz glass product.
Refining, which refers to the removal of bubbles, consists of two procedures. In the first procedure, the diffusion of gases such as O2 and CO2 is facilitated through the reduction reaction of a refining agent, such as Na2SO4, at a high-temperature; this reaction enhances the merging of the bubbles, and the resulting enlarged bubbles rise to the surface due to their increased buoyancy. In the second procedure, N2 gas is supplied during cooling to greatly increase the cooling rate and shrink the bubbles to dissipation. In a rapid cooling process in which the viscosity is high, the second procedure is necessary because it is difficult to form large bubbles by merging smaller bubbles, which are not easily transported for merging by the differences in the viscosity and density.4)
The movement speed of a bubble may be expressed using Stoke’s law, which is related to falling motion in a viscous fluid:
where V denotes the movement speed of a bubble, r is the radius of the bubble, g is gravity, ρ is the density of the bubble, ρ′ is the density of the fluid, and η is the viscosity of the fluid. In this equation, the movement speed of a bubble is proportional to the bubble radius, the acceleration, and the density difference, and is inversely proportional to the fluid viscosity.5)
The effects of alkaline elements in glass on the viscosity have been investigated for a long time. In an R2O·SiO2 two-component system glass, an alkaline ion is located at a vacancy of the SiO2 network structure. In R2O, an alkaline ion replaces a hydrogen ion existing in SiO2 glass by breaking the Si-O-Si bond, as shown in the following reaction formula:
As ion substitution by added alkaline ions, which are network-forming modifier ions, increases, the R2O, Si-O-Si bonds are broken; the number of broken network structures per unit volume also increases, resulting in a decrease of the internal viscosity.6-10)
Many studies have been conducted on using alkaline additives to manufacture glass. However, such study has rarely been conducted in Korea with quartz glass, because quartz glass has a very low impurity content, a network structure, and a high melting point. In the present study, to improve the quality of quartz glass by reducing the bubbles, SiO2 powders prepared by adding potassium (K) as an alkaline additive at different ratios were melted using a high-temperature vacuum furnace; in this way, the bubble-reducing effect of the method was verified. In addition, the number and size of the bubbles, depending on the K ratio, were visually compared to verify the effect of the K ratio on the bubble fraction and the OH content.
2. Experimental Procedure
IOTA-CG SiO2 powder manufactured by Unimin was used to prepare the quartz specimens. K was added using a 1N-potassium hydroxide(KOH) standard solution (Daejung Chemicals & Metals. Co. Ltd.) with a K content in a range of 0 to 100 ppm.
As shown in Table 1, the SiO2 powder and the KOH aqueous solution were mixed in a Nalgene container and then dried using a drying oven at 120°C for 24 h. After mixing and drying, the SiO2 powder was poured into a Φ50 mm graphite mold; then, the temperature was increased to 1850°C at a rate of 5°C/min in a vacuum atmosphere (5 × 10⁻³ torr) by using a high-temperature vacuum furnace (Thermvac Inc.). Melting was performed at 1850°C for 1 h; cooling was performed under atmospheric pressure by supplying N2 gas having a purity of 95%. Fig. 1 shows the process conditions.
After completing the melting and cooling, to observe the bubbles and to measure the OH content, the specimens underwent coring to a size of Φ33.75 mm; then, the top and bottom surfaces were cut to adjust the specimen thickness to 5 mm. After processing the specimens, both sides of the specimens were polished to #1200. Bubbles were observed using a stereoscopic microscope (Sometech SV-55). The bubble size and number were measured within a cross-sectional area of 12 mm × 24 mm at the centers of the specimens, according to the KS B ISO 12123 (Raw optical glass in bulk and preshaped forms. Bubbles and other inclusions - Test method and classification). The bubble fraction was calculated using the measured bubble number and the bubble size, while assuming the bubbles to be spherical. In addition, the OH content was analyzed using Fourier-transform infrared spectroscopy (FT-IR).
3. Results and Discussion
Figure 2 shows the regions from which the specimens were taken and the completely prepared specimens.
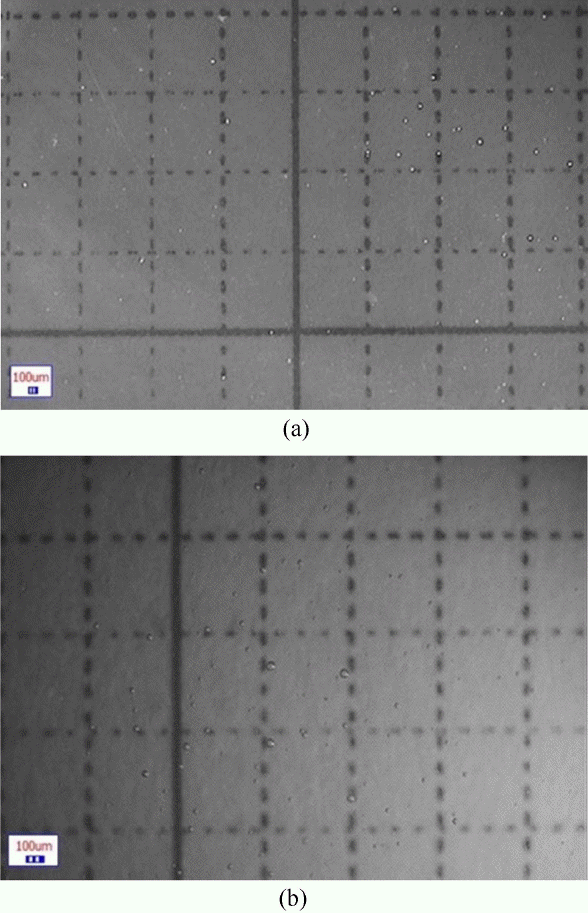
The processed specimens were observed using a stereoscopic microscope at magnifications of 20 and 40 times. Fig. 3 shows the observation images.
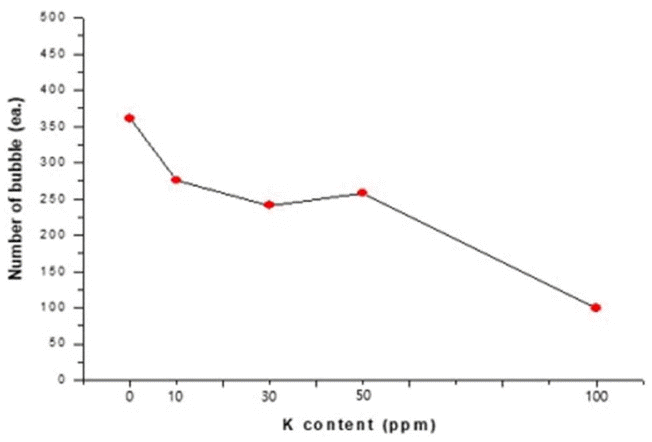
Figure 3 is a dark-field image of a quartz glass specimen containing 30 ppm of K at a magnification of 20 times, wherein the bubbles are shown as white granules. A closer observation of the bubbles at a magnification of 40 times showed that the bubbles were spherical. To analyze the number of bubbles depending on the K content, the number of bubbles within a quartz glass cross-sectional area of 12 mm × 24 mm was counted, as shown in Fig. 3(a). Fig. 4 shows the relation between the number of bubbles and the K content.
As shown in Fig. 4, the number of bubbles decreased as the K content increased. According to Equation (1), the movement speed of a bubble is proportional to the density difference between the melt glass and the gas inside the bubble, and inversely proportional to the viscosity. As the network structure was broken during the melting process due to the added K, the internal viscosity decreased, and thus the bubbles moved more smoothly, resulting in a decrease of the number of bubbles. This may correspond to the first procedure, in which the merging of bubbles is enhanced and thus enlarged bubbles rise to the surface due to increased buoyancy for removal. In addition, in the second procedure, as N2 gas was supplied for rapid cooling, the viscosity increased and thus the internal pressure of the bubbles increased due to the external pressure, causing the remaining micro-bubbles to shrink and dissipate.
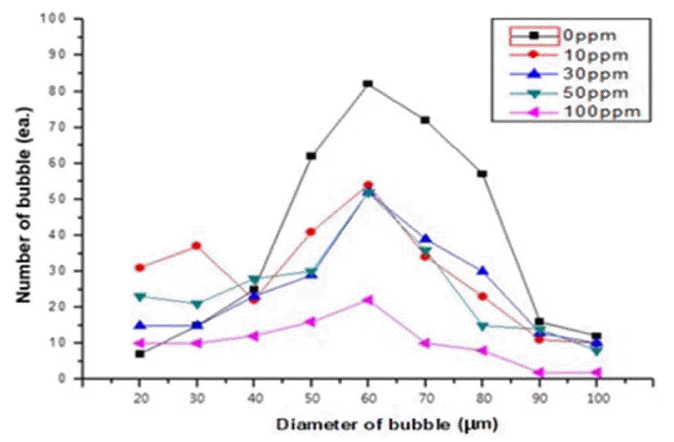
The results of the present study show that bubbles were reduced more at a K content of 100 ppm than at K contents in a range of 10 to 50 ppm. This suggests that a higher K content increases the alkaline reaction of Equation (2), resulting in the breakage of more Si-O-Si bonds. Fig. 5 shows the bubble size depending on the K content.
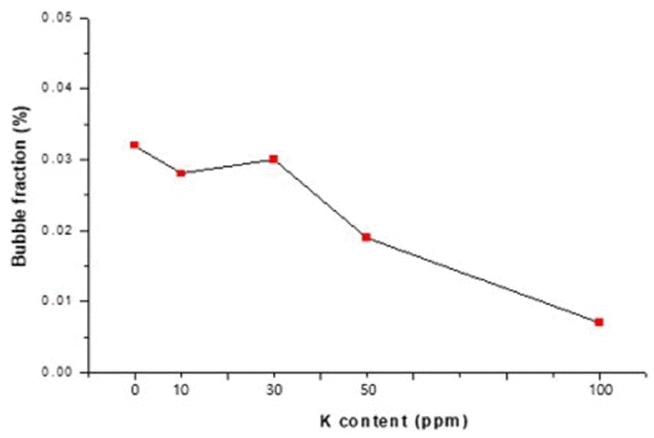
The general bubble size distribution was in a range of 20 to 100 μm; the number of bubbles in each size interval decreased as the K content increased. Fig. 6, based on the results shown in Figs. 4 and 5, shows the relation between the bubble fraction (%) in each specimen and the K content (ppm).
Assuming that 100% of bubble fraction refers to bubbles occupying an entire specimen, the bubble fraction was 0.032% with no K, 0.028 to 0.030% at a K content of 10 to 30 ppm, 0.01% at a K content of 50 ppm, and 0.007% at a K content of 30 ppm. This shows that the effect of K to reduce the bubble fraction in a specimen was small at a K content of 30 ppm or lower but great at a K content of 50 ppm or higher. In particular, at a K content of 100 ppm, the bubble fraction was reduced by about 78% in comparison with that of the specimen without K.
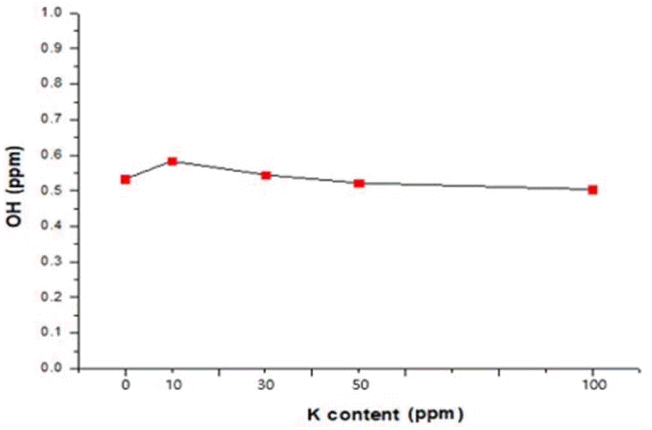
FT-IR analysis was performed to investigate the effect of the K content on the OH content in a specimen, with results shown in Fig. 7. The OH content (ppm) in the specimens was from 0.50 to 0.55 ppm. The OH content was 0.533 in the specimen with no K; the lowest value of 0.504 was achieved for the specimen containing 100 ppm of K. The OH content was probably low because the quartz glass was prepared by electric melting in a vacuum atmosphere. Considering the variation of the OH content depending on the K content, the K content did not have a significant effect on the OH content. Since the measurement values were also very small, the OH content is considered to have no significant effect on the quality of quartz glass products.
To investigate the effect of K content more precisely, further experiments may need to be performed with quartz glass samples having impurity contents of 50 to 100 ppm, and over 100 ppm. In addition, although it was found that the number of bubbles decreased as the K content increased, more studies should be conducted to consider the addition of alkaline impurities to quartz glass, because metal impurities contained in quartz glass may cause decreases in the high-temperature properties and withstanding voltage and serve as nuclei for the formation of Cristobalite grains, which would result in glass whitening.
4. Conclusions
In the present study, to investigate the effect of the content of K, an alkaline impurity, on the properties of bubble in quartz glass, KOH aqueous solution was added to SiO2 powder and the resulting mixture was melted by electric melting in vacuum atmosphere. Analysis of the bubble number and bubble size as they depended on K content, performed using a stereoscopic microscope, showed that the number of bubbles decreased most at a K content of 100 ppm. The bubble size was found to be in a diameter range of 20 to 100 μm. Assuming that the bubbles were spherical, the bubble fraction was calculated according to the number and the size of the bubbles. The calculated bubble fraction greatly decreased at a K content of 100 ppm: in comparison with the specimen without added K, the bubble fraction decreased by about 78% at a K content of 100 ppm. Results of FR-IR analysis show that a K content under 100 ppm did not affect the OH content in quartz glass.


