Quantitative Photocatalytic Activity under Visible Light with Mn-ACF/TiO2
Article information
Abstract
Manganese and TiO2 grown on Activated Carbon Fiber (ACF) was synthesized by hydrothermal method. The prepared composites were characterized by X-ray diffraction (XRD) and scanning electron microscopy (SEM) with energy dispersive X-ray (EDX). The catalytic behavior was investigated through the decomposition of methylene blue (MB) and methyl orange (MO) as standard dyes under visible light. The degradation performance of the degraded standard dye solutions was determined by UV-Vis spectrophotometry. This enhanced photocatalytic activity arises from the positive synergetic effect among the Mn, TiO2 and ACF in this heterogeneous photocatalyst. The process contributes to the release of abundant photocatalytic sites of Mn and TiO2 and improves the photocatalytic efficiency. The excellent adsorption and photocatalytic effect with the explanation of the synergetic mechanism are very useful not only for fundamental research but also for potential practical applications.
1. Introduction
Titanium dioxide (TiO2) has advantages over other photocatalysts such as high activity, good stability, low cost and nontoxicity to humans. However, the main shortcoming of TiO2 is its relatively large band-gap (anatase: 3.2 eV). As a consequence, TiO2 shows photocatalytic activity only in the near ultraviolet region and can get only a small fraction of incident solar irradiation.1–4) Therefore, modifying TiO2 photocatalysts to enhance light absorption and photocatalytic activity under visible light irradiation has become the main research direction in recent years.
In the last two decades, Activated Carbon Fiber (ACF), widely used as an effective adsorbent in treating polluted water and gas, has been introduced as a support for TiO2 photocatalysts in several studies.5–8) ACFs are one kind of highly microporous carbon material, having a higher surface area, larger pore volume and a more uniform micropore size distribution than those characteristics of granular activated carbon.9–11) However, so far there have been only a few reports that have studied preparation methods for and applications of ACF/TiO2 composites.
Doping metal ion to TiO2, which could introduce defects in the lattice or change the crystallinity, would extend the photocatalytic functionality into the visible light range and lead to the more efficient separation of photo electrons and holes as well. Manganese oxides have also been used as adsorbents for dye decomposition. However, the use of manganese oxide modified ACF for dye decomposition has not been reported. In the present study, manganese-modified TiO2 located on activated carbon fiber (Mn-ACF/TiO2) was prepared; the degradation performance of the MB solution was determined by UV-Vis spectrophotometry.12–16)
In this study, we have focused on characterization of the obtained Mn-ACF/TiO2 composite in porous ACF and the formation of TiO2 derived from titanium n-butoxide (TNB). The conversion of TNB to TiO2 during heat treatment is important for the preparation of Mn-ACF/TiO2 composites. The as-prepared Mn-ACF/TiO2 catalysts were characterized using XRD, EDX and SEM. The catalytic behavior was investigated through the decomposition of standard dyes (MB, MO). The degradation performance of degraded MB and MO solutions was determined by UV-Vis spectrophotometry.
2. Experimental Procedure
2.1 Materials
Self-made ACFs used as precursor fiber material were prepared from commercial PAN based carbon fibers (T-300 Amoco, USA). The carbon fibers were activated by steam diluted with nitrogen in a cylindrical alumina tube at a temperature of 1073 K for 30 min. These ACFs were washed with deionized water and dried for 24 h at ambient temperature. For the treatment of Mn sources to ACF matrix, MnCl2 was obtained from Duksan Pure Chemical Co. (99+%, ACS reagent, Korea) and used as received. In the process of metal treatment, 2 g of ACF was dipped into 100 mL of 1.0, 2.0 and 3.0 M MnCl2 solutions and stirred for 24 h at room temperature. The samples obtained were then dried at 383 K for 48 h in an air atmosphere. For the TNB treatment of Mn-TiO2, we prepared Mn-containing ACF slurry solutions with pristine concentrations of 4 mL of titanium n-butoxide (TNB, C16H36O4Ti, Acros Organics, USA) for the preparation of the Mn-ACF/TiO2 composites. Then, the solvent in the mixtures was vaporized at 343 K for 1 h. The powder mixtures of TNB and Mn-ACF were heated at 973 K for 1 h. The simple preparation method and nomenclature of the prepared samples are listed in Table 1.
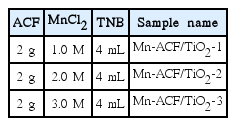
Nomenclature of Pristine ACF and Mn-ACF/TiO2 Composites Prepared with Different Concentrations of MnCl2 and ACFs
2.2 Characterization of the samples
XRD (Shimatz XD-D1, Japan) analysis using Cu Ka radiation was performed to assess the crystallinity and phase transition of the synthesized catalysts. An elemental analyzer was used to obtain EDX spectra for the prepared composites. For the measurement of the photo-degradation effects, UV/vis spectra for the aqueous solutions decomposed with Mn-ACF/TiO2 composites were obtained using a scanning UV-Vis spectrophotometer (Neosys-2000) equipped with an integrating sphere assembly. The BET surface area of the photocatalysts was determined by nitrogen adsorption at 196 °C using a BET analyzer (Monosorb, USA). SEM (JSM-5200 JOEL, Japan) was used to observe the surface state and structure of the Mn-ACF/TiO2 composites.
2.3 Photocatalytic studies
The photocatalytic activity of the as-prepared Mn-ACF/TiO2 nanocomposites was evaluated by the degradation of MB under visible light. An LED lamp (8W, λ > 420 nm, KLD-08L LED lamp) served as the simulated visible light source. In each run, 10 mg of the Mn-ACF/TiO2 catalytic sample was added to a 50 ml solution of MB (0.1 mg ml−1). To obtain adsorption–desorption equilibrium, the solution was kept in the dark for 2 h. Before the LED lamp was switched on, each sample was collected from the solution and kept in a centrifuge at 10000 rpm for the removal of solid material. Afterwards, the LED lamp was switched on and samples were collected periodically. At given time intervals, the collected samples were immediately centrifuged for 10 minutes to remove solid material for further analysis. Each photocatalyst composite was irradiated for 150 minutes to compare its catalytic efficiencies.17–20)
3. Results and Discussion
3.1 Characterization
XRD patterns were used to identify the crystallite phases of the Mn-ACF/TiO2 nanocomposites with varying ACF contents. Fig. 1 compares the XRD patterns of the Mn-ACF/TiO2 nanocomposites. The results of XRD for all composites show no diffraction peaks for the carbon matrix as corresponding to the inorganic amorphous phase. The Mn-ACF/TiO2 composites with different compositions exhibit characteristic (101), (004), (200), (105), (211) and (220) reflections that correspond to the anatase crystal phase. By applying the Scherrer equation to the strongest (101) peak, the nano-crystal sizes of the Mn-ACF/TiO2-1, Mn-ACF/TiO2-2 and Mn-ACF/TiO2-3 are found to be 7 – 8 nm, 9 – 10 nm and 10 – 11 nm, respectively. With increasing Mn concentration, the intensity of the peaks of all the lattice planes increases. The peak intensity of Mn-ACF/TiO2-3 is stronger than that of the others, indicating that high Mn2+ concentration helps to increase the particle size.
XRD patterns of prepared samples.
The EDX analysis data of the Mn-ACF/TiO2 composites are listed in Table 2. These spectra show the main elements as C, O and Mn, with strong Ti peaks. Most of these samples were much richer in carbon and major oxygen than in any other elements. C, Mn and Ti were confirmed as componential elements in most of the Mn-ACF/TiO2 samples. These results show the spectra corresponding to almost all samples decreased in C elements and increased in O, Mn and Ti elements. This means that special effects have been dedicated to the treatment of Mn. This interest is based on the idea that Mn ions act as shallow charge traps or electron–hole recombination centers in the composite.21–23)
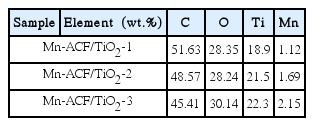
EDX Elemental Microanalysis of Mn-ACF/TiO2 Samples
The BET surface areas of the samples are shown in Table 3. This value decreased from 1093.6 m2/g for Mn-ACF/TiO2-1 to 982.3 m2/g for Mn-ACF/TiO2-3. This was because Mn and TiO2 nanoparticles were introduced into the pores of the ACF, decreasing the BET surface area. Mn-ACF/TiO2-1 has the largest area. From the values, it is evident that the ACFs have good BET values that can affect the adsorption reaction time.
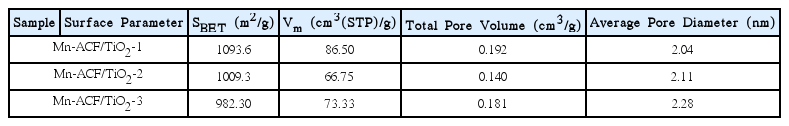
BET Surface Area of As-Prepared Catalysts
The SEM images of the Mn-ACF/TiO2 composites are shown in Fig. 2. It can be sen that the titanium complexes containing particles are evenly distributed in all types of the Mn-ACF/TiO2 composites. The average particle size, estimated from SEM observations, was not considerably large in the composites prepared from iron and titanium sources. Although the titanium complex particles on the carbon surfaces become pronounced and coarse, no iron complex particles were observed due to ionic size. The needle-like crystals on the surface of Mn-ACF/TiO2 should be manganese species. It was reported that there are some organic groups such as carboxyl (−COOH) and hydroxyl (−OH) groups on the surface of ACF,24–25) which facilitate the adsorption of Mn2+ ions and TiO2 on the surface of ACF by electrostatic interaction.

SEM images of Mn-ACF/TiO2-1 (a), Mn-ACF/TiO2-2 (b) and Mn-ACF/TiO2-3 (c)
3.2 Novel photonic performance of dyes
Figure 3 shows the MB degradation versus time using Mn-ACF/TiO2-1, Mn-ACF/TiO2-2 and Mn-ACF/TiO2-3 under visible light. The spectra for the MB solution after visible light irradiation showed relative degradation yields at different irradiation times. The dye concentration continuously decreased with a gentle slope; this was due to visible light irradiation. The concentration of MB was 5.0 × 10⁻⁵ mol/L, and the absorbance for MB decreased with increasing visible light irradiation time. Moreover, the MB solution increasingly lost its color as the MB concentration continued to decrease. Two steps are involved in the photocatalytic decomposition of dyes: adsorption of dye molecules and their degradation. After adsorption in the dark for 120 min with magnetic stirring, the samples were irradiated for 120 min under visible light. In the adsorption step, Mn-ACF/TiO2-1, Mn-ACF/TiO2-2 and Mn-ACF/TiO2-3 composites showed different adsorption capacities, with Mn-ACF/TiO2-2 having the highest adsorption capacity. In order to test the adsorption ability of the nanocomposites, the concentration changes of the MB solution were recorded and are shown in Fig. 4. It can be clearly seen that 30% of MB was degraded by the Mn-ACF/TiO2-2 nanocomposite. Adsorption of MB was slightly reduced by the incorporation of different amounts of MnCl2 to TiO2 in the composites. This is a possible reason for the light transparent increase with the decrease of MB concentration by photocatalytic combination effects. After that, the Mn-ACF/TiO2-2 samples were tried to degrade MO solution under visible light irradiation (Fig. 5). The absorbance spectral lines clearly indicate the gradual, significant and steady decrease in the absorbance with each passing time interval of 30 min for the MO solution. The maximum absorbance peak λmax for MO was observed to be at 462 nm. The degradation of MO at the λmax wavelength was calculated and found to be 35% by the end of 120 min of exposure. It is obvious that Mn-ACF/TiO2-2 also has a high photocatalytic effect against MO dye. In previous research,26–27) it was concluded that the decrease in absorbance for an organic dye should be attributed to a degradation reaction by certain kinds of carbon and TiO2 composite photocatalysts.
UV/vis spectra of MB concentration against the Mn-ACF/TiO2 composite under various time conditions; Mn-ACF/TiO2-1 (a), Mn-ACF/TiO2-2 (b) and Mn-ACF/TiO2-3 (c), respectively.
Degradation of MB under visible light irradiation with magnetic stirring over Mn-ACF/TiO2-1, Mn-ACF/TiO2-2 and Mn-ACF/TiO2-3. c is the concentration of MB solution, and c0 is the initial concentration.

UV/vis spectra of MO concentration against the Mn-ACF/TiO2-2 sample under visible light irradiation.
In order to further demonstrate the photostability and cycle performance of the Mn-ACF/TiO2 samples, circulating runs in the photocatalytic degradation of MB in the presence of Mn-ACF/TiO2-2 under visible light were conducted. As shown in Fig. 6, the photocatalyst did not exhibit any significant loss of photocatalytic activity after 3 runs of MB degradation, which indicates that the Mn-ACF/TiO2-2 photocatalyst had high stability and cannot be photocorroded during the photocatalytic oxidation of the MB solution. Thus, the Mn-ACF/TiO2-2 composite photocatalyst is promising for practical applications in environmental purification. This Mn-ACF composite can improve not only the photocatalytic performance of TiO2 but also the long-term stability of the TiO2 nanocrystals. These results are significant from the viewpoint of practical application because enhanced photocatalytic activity and prevention of catalyst deactivation will lead to a more cost-effective operation.28–30)

Cycling runs for the photocatalytic degradation of MB with Mn-ACF/TiO2-2 sample under visible light irradiation.
4. Conclusions
In the characterization of Mn-ACF/TiO2 composites prepared from Mn-ACF and TNB, the adsorption and surface properties, and the structural and chemical composition were investigated through synthesis of the Mn-ACF/TiO2 composite. The X-ray diffraction patterns varied with strong peaks of anatase and Mn phase for the Mn-ACF/TiO2 composite. The EDX spectra showed the presence of major elements of C, O, and Mn, with strong Ti peaks. The surface properties were confirmed in SEM images of the texture on the Mn-ACF/TiO2 composite. Finally, the photo-degradation of organic dye by Mn-AC/TiO2-2 shows excellent photocatalytic effects and high stability.