


1. Introduction
Environmental problems are often linked with the use of commercial dyes, and estimated that more than 10000 dyes and pigments are being used in industrial technology, i.e. in textile, paper, food, cosmetic and drug manufacturing. A majority of dyes contain large number of organic compounds and toxic effluents and have effects on humans as well as aquatic life.1,2) Consequently, the eradication of dyes from wastewater has received more attention. Numerous techniques, i.e. electron oxidation, ozonation, electro-kinetic coagulation with ions, membrane filtration and microbial degradation have been explored to eliminate dyes.3-8) Among these techniques, heterogeneous photocatalysis by semiconductors materials is a promising technique and has been widely used for the removal of toxic dyes. Because this process has well-defined electrochemistry, excellent redox recyclability and outstanding environmental stability, the photocatalytic degradation technique was chosen in this research as a process to eliminate dyes form wastewater. Furthermore, TiO2 due to its unique properties broadly use for many applications. However, the uses of TiO2 is still limited due to this material’s high energy band gap (3.2 eV) and fast recombination of electron hole pairs, : the photo generated electrons and holes in excited states are unstable and promptly recombine, dissipating the input energy as heat and resulting in a minimizing of thee photocatalytic efficiency.9-11) Many approaches have been attempted to overcome these obstacles, i.e. doping with metals, coupling with a second semiconductor or TiO2 nanoparticles and anchoring with carbonaceous materials, which create localized states between the valence band and the conduction band. These mid-gap states can temporarily low down photo generated electron-hole pairs.12,13) Recently, graphene has been broadly used in coupling with various to couple various semiconductor materials. The thermal conductivity (≈ 5000 Wm−1k−1), high surface area (≈ 2600 m2g−1) and excellent stability of graphene make it a promising candidate that can ensure the attachment of semiconductor materials on its surface and facilitate the charge transfer mechanism.14,15) The oxygen functionalities are affected by the particle size and by the shape of the semiconductor material on the graphene sheet. Surface modifications of graphene materials open up new ways of establishing and designing semiconductor photocatalysts with desirable properties. Lee et al. reported that graphene can serve as a photosensitizer to enhance light response; it can also reduce the band gap of TiO2.16) Furthermore, transition metal chalcogenides/dichalcogenides MX2 (M = Fe, Mn, Ni, Co; X = Se, S, Te) have recently attracted more attention due to their unique electronic and optical properties and positional applications. The direct band bap energy of cobalt selenide [(CoSe2) ≈ 1.0 eV] and its large absorption coefficient (α > 1.0 × 105 cm−1) makes this material favorable for fundamental research and for potential applications in photocatalysis.17) Kef et al. reported CoSe2-graphene-TiO2 hybrid heterostructures, as a high-performance photocatalyst material for the hydrogen evolution reaction (HER).18) Here, we study cobalt selenide nanoparticles that were attached to graphene through ultra-sonication techniques.
In this procedure, GO is consolidated with cobalt and Se precursor materials under proper conditions. During ultra-sonication, graphene oxide converts to graphene and CoSe2 nanoparticles are attached to the graphene sheets. The photo catalytic activities were tested with Rh. B as a standard dye under visible light irradiation.
2. Experimental Procedures
2.1. Materials
Cobalt chloride (CoCl2), ammonium hydroxide (NH4OH, 25 - 28%), selenium powder (Se, 99%), Sodium sulfite (Na2-SO3), and ethyl alcohol (94%) were purchased from Duksan Pure Chemical Co. Ltd., Korea. Rhodamine B (Rh. B), purchased from Texchem Korea Co. Ltd., was used as a standard industrial dye, All chemicals were used without further purification. All dilutions were carried out using distilled water.
2.2. Preparation of CoSe2 composite
Cobalt selenide was successfully prepared through an ultra-sonication technique. In the synthesis procedure, 2 g of anhydrous Sodium sulfite (Na2SO3) and 0.5 g of crude selenium (Se) powder were mixed together in 200 mL of ethylene glycol and stirred under vigorous magnetic stirring. To obtain selenium salt, the solution was stirred continually until the mixture was homogeneous. After that, 0.6 mmol of cobalt acetate was mixed with the above prepared solution and stirred for 20 minutes to obtain a stable solution. Finally, the homogeneous solution was treated by ultra-sonication for 3 h, with a digital sonicator. The CoSe2 precipitates were obtained using 47 mm Whatman filter paper: precipitates were then heat treated for 5 h at 90°C.
2.3. Preparation of CoSe2-graphene and CoSe2-graphene-TiO2 nanocomposites
Graphene oxide (GO) (obtained by Hummer’s-Offeman method19)) and a 0.9 molar solution of CoSe2 particles were dispersed in 200 ml of ethylene glycol at a ratio of 1 : 1 and vigorously stirred for 30 min at 50°C. After ultra-sonication, the graphene oxide was reduced to graphene nanosheet. CoSe2 compounds were decorated on the graphene sheet to generate CoSe2-graphene composites. After filtering with 47 mm Whatman filter paper with a pore size of 0.7 mm, the prepared solution was allowed to cool and settle at room temperature. The resultant powder was washed with distilled water 5 times and then transferred into a dry oven for 5 h at 90°C in a furnace. CoSe2-graphene-TiO2 nanocomposites were prepared following the same procedure described above. 150 mg of GO and similar amount of titanium precursor (TNB) were dissolved in 200 mL of ethylene glycol for 30 minutes to obtain a homogenous solution; this was denoted as solution A. In the second step, 1.5 g of Na2SO3 and 0.2 g of Se were mixed in 200 mL of ethylene glycol and stirred until a homogenous solution was obtained; this was denoted as solution B. Finally the solutions marked A and B were mixed together under stirring for 30 min and then sonicated at room temperature using a controllable serial-ultrasonic apparatus (Ultrasonic Processor, VCX 750, Korea). The mixture solution was allowed to cool to room temperature and filtered with 47 mm Whatman filter paper at pore size of 0.7 mm. The resultant powder was washed 3 times and transferred to dry even for 5 h at 90°C before heat treatment at 500°C for 2 h. The prepared samples were marked CoSe2, CoSe2-G, and CoSe2-g-TiO2, respectively.
2.4. Photocatalytic activity of Rhodamine B (RhB)
The adsorption and degradation activity of the as-prepared CoSe2-G-TiO2 were evaluated under visible light (xenon 8 W, λ > 420 nm) using RhB as a standard dye. In the experimental process, 30 mg of the CoSe2-G-TiO2 catalytic sample was dissolved in a 100 ml solution of RhB (2.0 × 10⁻⁶ mol/L) and vigorously stirred for 2 h in a dark box until solution attained absorption-desorption equilibrium. Before switching on the light source a sample was collected from the solution and put in a centrifuge at 10000 rpm for the elimination of solid materials. During the degradation process, using a pipette, 2 mg mL (CoSe2-G-TiO2) solution was collected every 30 min and centrifuged for 10 min to remove any suspended solid. A spectrophotometer (TU1810, Puxi Company, China) was used to analyze the withdrawn sample determine the UV-vis spectra. All the samples were irradiated for 180 min to compare their catalytic performance.
2.5. Characterization
The crystallinity of the CoSe2-G-TiO2 nanocomposite was investigated using monochromatic high intensity Cu Kα radiation (λ = 1.5406 A) in XRD (Shimadzu XD-D1). The surface morphology, including such aspects as the composition, and crystallization of the prepared simple, was studied using a scattering electron microscope (SEM) (JS M-5600 JEOL, Japan) and a transmission electron microscope (TEM) (JEOL, JEM-2010, and Japan). The change in absorbance was measured using a UV-Vis spectrophotometer (Optizen POP, Korea). Raman spectra of the prepared samples were studied using a spectrometer (Jasco, NRS-3100) with an excitation laser wavelength of 532.06 nm
3. Results and Discussion
3.1. Material characterization
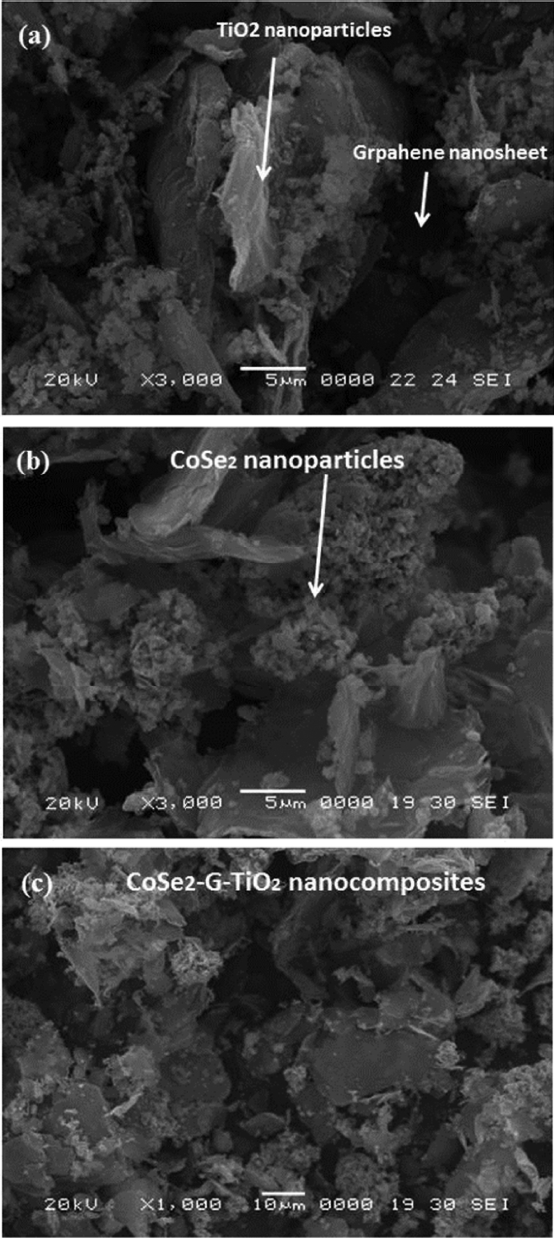
We analyzed the crystallographic structure of the prepared sample through XRD techniques. Fig. 1 displays the XRD results for the CoSe2-G-TiO2 composites. The XRD pattern of CoSe2-G has diffraction peaks at around 2θ of 27.5, 33.5, 36.6, 37, 41.5, 43.6, 47.5, 51.2, 58.8, 61.2 and 65.2°, which can be indexed to the characteristic peaks of (011), (101), (111), (200), (210), (121), (211), (002), (031), (022) and (320) plane reflections with lattice parameter a = 4.850, b = 5.827, c = 3.628, and space group Pnnm (58) (JCPDS PDF#00-053-0449). The XRD pattern of TiO2 has diffraction peaks at around 2θ of 25.5, 38.5, 48.6, 56.5, 64.6, 68.2 and 75.5°, which can be indexed to the characteristic peaks of (101), (112), (200), (211), (204), (116), (220) and (216), which correspond to the anatase crystal phase (JCPDS PDF#00-021-1272). Moreover, TiO2 (101) and graphene (002) peaks are located at the same 2θ values. This demonstrates the successful formation of the CoSe2-G-TiO2 ternary nanocomposite. The surface morphology of the TiO2-G, CoSe2-G and Cu2Se-G-TiO2 nanocomposites were examined by scanning electron microscopy (SEM). The images in Fig. 2(a-c) show the overall structure of the nanocomposites; it can be clearly seen that the graphene has a plate- like structure and that the TiO2, and CoSe2 nanoparticles are amalgamated into a group of Clusters. Fig. 2(a) shows that the TiO2 nanoparticles are unevenly distributed on the graphene sheet. On the other hand, Fig. 2(b) shows that the CoSe2 partilcles have spherical shapes and are partially agglomerated on the graphene sheet. The attachment of nanoparticles is very useful to overcome the interaction between functionalities on the graphene surface. Fig. 2(c) shows the structure of the CoSe2-G-TiO2 ternary nanocomposite. In this figure, it can be clearly observers that the TiO2 has dispersed on the graphene sheet and on the supporting the CoSe2 nanoparticles. Further transmission electron microscope (TEM) imaging is used to confirm the shape of the TiO2 and CoSe2 nanoparticles. TEM analysis, carried out to determine the microscopic structure information of the CoSe2-G-TiO2 ternary nanocomposite, is shown in Fig. 3(a-c). To explain show the surface morphology and the overall history of the graphene sheet and the CoSe2-TiO2 nanoparticles, the images in Fig. 3(a-c) were taken at different magnifications. Fig. 3(a-b) displays 200 nm magnification images of the CoSe2-G-TiO2 ternary nanocomposite. In these images, CoSe2 nanoparticles can be seen to have almost spherical form; there is also a tube type of TiO2 partially agglomerated on the graphene sheet. Moreover, the graphene sheet provides a large plate like structure; there are also tube type TiO2 supported CoSe2 nanoparticles on the graphene sheet. These interactions between the graphene sheet and the TiO2, and CoSe2 nanoparticles increase the electrocatalytic performance.20) Fig. 3(c) shows bunches of tube type TiO2 and CoSe2 nanoparticles attached to the graphene surface. This is clear evidence of the good contact and interaction among the TiO2 and CoSe2 nanoparticles and graphene. Thus, we can say that ultra-sonication synthesis of a ternary nanocomposite is superior to other techniques, and will be favorable for the enhancement of the photo catalytic efficiency of the CoSe-G-TiO2 ternary nanocomposite. The Raman spectra technique provides structural information for carbon-based materials (e.g., number of layers and crystal structure). Raman spectroscopy of graphene is usually used to characterize two prominent peaks: the D and the G band. The D band is induced by defects that usually occur at 1350 cm−1, while the G band is induced by sp2 carbon bands observed at 1575 cm−1. The Raman spectra of the CoSe2-G-TiO2 nanocomposites had a D band at 1350 cm−1 and a G band at 1589 cm−1 (Fig. 4). These two peaks, the G band and the D-band, provide information on the nature of the carbon-carbon bonds and the formation of defects caused by the distortion of the sp2 bonded carbon atoms.21) The characteristics of the peaks around 100 cm−1 to 250 cm−1 are attributed to the CoSe2 crystal; peaks observe these, located at 392, 561 and 640 cm−1, correspond to the B1g(1), A1g + B1g (2), and Eg (2) modes of anatase TiO2.22,23) The relative intensity of the D band compared to that of the G band (ID/IG) is calculated and found to be about approximately 1.002. These results reveal that the introduction of TiO2 still affects the ratio and leads to an increased number of defects.24-26)
3.2. Photocatalytic performance
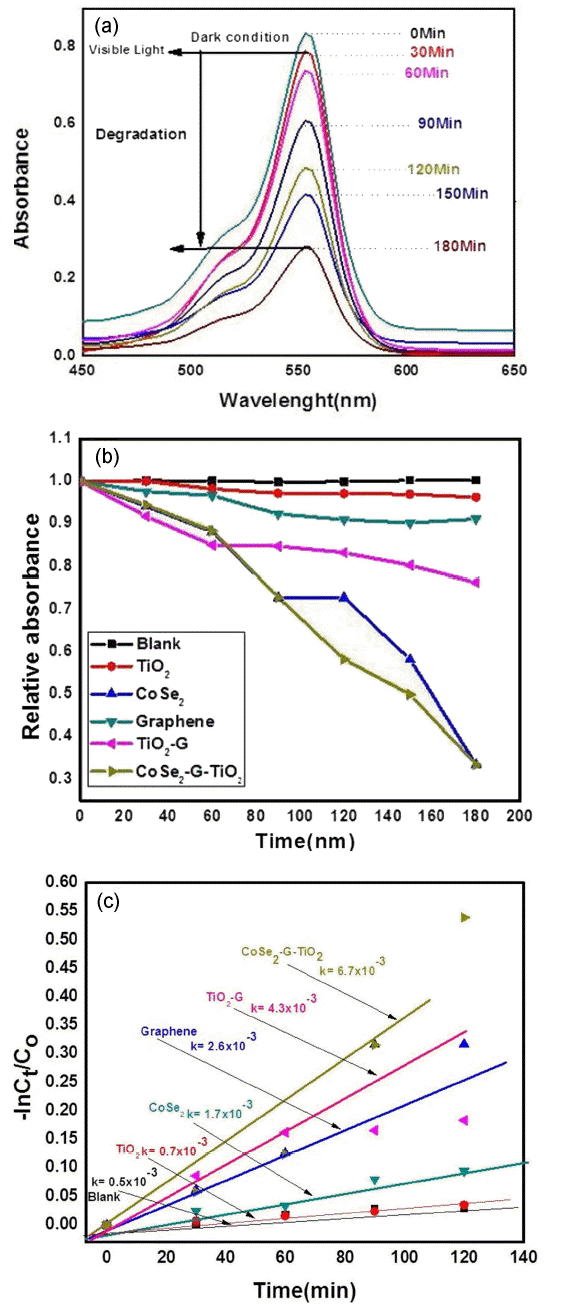
The photocalytic activity of the CoSe2-graphene nanocomposite using RhB as an organic dye under visible irradiation was investigated and results are shown in Fig. 5(a-c). Fig. 5 shows the adsorption capability of the CoSe2-G-TiO2 ternary nanocomposite. Fig. 5(a) shows a decline in the intensity of the electronic absorption spectra (λmax) with different intervals of time, which demonstrates the degradation of RhB in the presence of CoSe2-G-TiO2 catalysts. The λmax value of CoSe2-G-TiO2 was found to be 553 nm; the sample had degraded by approximately 85.2% at the end of 180 min. In the degradation experiment depends following factors, (1), the absorption by the CoSe2-G-TiO2 photocatalyst, (2), the fast charge transfer route and (3), graphene.
First two steps, to decompose the organic pollutants. While graphene acts an adsorption support material, and the dye absorbs molecules on the surface of graphene via π-π interaction, Fig. 5(a) shows that the concentration of RhB changes at different intervals of time, which shows the good absorption efficiency of RhB in the CoSe2-G-TiO2 nanocomposites. To achieve adsorption-desorption equilibrium, the prepared sample was kept in the dark for 30 min: after obtaining the adsorption-desorption equilibrium, the solution was kept in a closed box and visible light was turned on. The solution was irradiated for 30 min: every 30 min, the sample was withdrawn from the chamber for further syntheses. Then, the sample was centrifuged and the dye concentration was determined using a UV -visible spectrometer. The photo catalytic performances of the different products were evaluated under visible light irradiation. Fig. 5(b) shows the photocatalytic degradation of the different samples with different intervals of time. Fig. 5(b) shows that the photocatalytic degradation performance of the CoSe2-GTiO2 nanocomposites is higher than those of TiO2, CoSe2, graphene, and TiO2-G. With the increase of the time, the intensity of the characteristic absorption band of Rh B (553 nm) significantly decreased: after 180 min, approximately 85.2% of the organic dye had been degraded. Furthermore, the kinetics of the degradation can be expressed as
where Kappt is the apparent rate constant, and. The kinetic plot and the apparent rate constant (Kaap) are shown in Fig. 5(c). It can be clearly seen that, with coupling of CoSe2 and pure TiO2 and graphene, the photocatalysis rate increased from 4.3 × 10⁻³ to 6.7 × 10⁻³ min, which is more than six times higher than that of pure TiO2.
4. Conclusions
In summary, CoSe2-G-TiO2 was prepared via ultrasonic technique. SEM and TEM images clearly show that CoSe2 was uniformly dispersed on the graphene sheets. Detailed study revealed that the CoSe2-G-TiO2 is a much more effective catalyst for photodegradation than is pure TiO2, CoSe2-G binary nanocomposite. Moreover, graphene acts an adsorption support material, and interacts between the composite and the dye molecules on the surface of the graphene. The present study has opened a new way of using graphene based materials to develop an extraordinarily efficient ternary system for photocatalytic degradation of organic dyes.