


1. Introduction
Inorganic pigments, which are manufactured mainly from metallic compounds, have higher chemical and physical stability than organic pigments against UV light, polluted materials, and the surrounding environment. In particular, inorganic pigments show stable color development at high temperatures between 500°C and 1000°C, and provide light resistance against the UV (resistance against degradation due to oxidation driven by light energy), moisture resistance, and durability. Moreover, with their relatively low production costs, they are widely used in various applications such as paints, varnishes, inks, ceramics, and glasses. However, inorganic pigments provide less vivid color and tint strength than organic pigments, and have a relatively narrow range of color formation. Even worse, it is difficult to control color formation owing to limited composition.1-4)
Currently, there is a strong interest in a wide variety of colors which the product has in various industrial sectors. Color trends have been released in various themes every year, which reveal that different colors are required. The color trends in 2014 and 2016 announced by Korea Color & Fashion Trend Center include natural and light colors like frost, pale lime yellow, and whispering blue as well as comfortable ones like illusion blue, egret, icicle, sandstorm, and shitake. [http://www.cft.or.kr/] Natural colors that can be harmonized with existing strong colors are in demand.
Mass produced inorganic pigments contain heavy metals such as cadmium (Cd), lead (Pb), antimony (Sb) and chromium (Cr).5,6) In particular, colors such as red, pink, and orange contain toxic or polluting substances of Cr-Sn-Ca-Si, Pb-Sb-Sn-Fe, and Mn-Al categories but have very limited alternatives in the composition for color formation.7) Most metal ions are non-toxic owing to their very low solubility in solvents, but the abovementioned heavy metals are ultimately harmful to humans and could affect the environment.8) To avoid the use of these heavy metals, a number of rules and regulations have laid out in accordance with the roadmap all over the world. According to the Registration, Evaluation, Authorization, and Restriction of Chemicals (REACH), EU manufacturers and importers are required to register all chemicals (products containing compounds and chemical compounds) weighing more than 1 ton in EU states, and the regulations on heavy metals are getting stricter and tighter. [http://ec.europa.eu/environment/]
This paper aims to synthesize the pigment in the TiO2-SnO-ZnO system and investigate the color formation mechanism depending on the composition. We demonstrate that various colors can be formed by the mixing ratio of raw materials based on the Design of Experiment, and attempt to analyze and control the color tendency of all the colors. The pigment was synthesized through the solid-state reaction and the heat treatment process was performed under reducing atmosphere with LPG.9) Then, the color formation, crystalline phase, and oxidation state of pigments were compared and analyzed to determine the color mechanism based on the composition.
2. Experiment Procedure
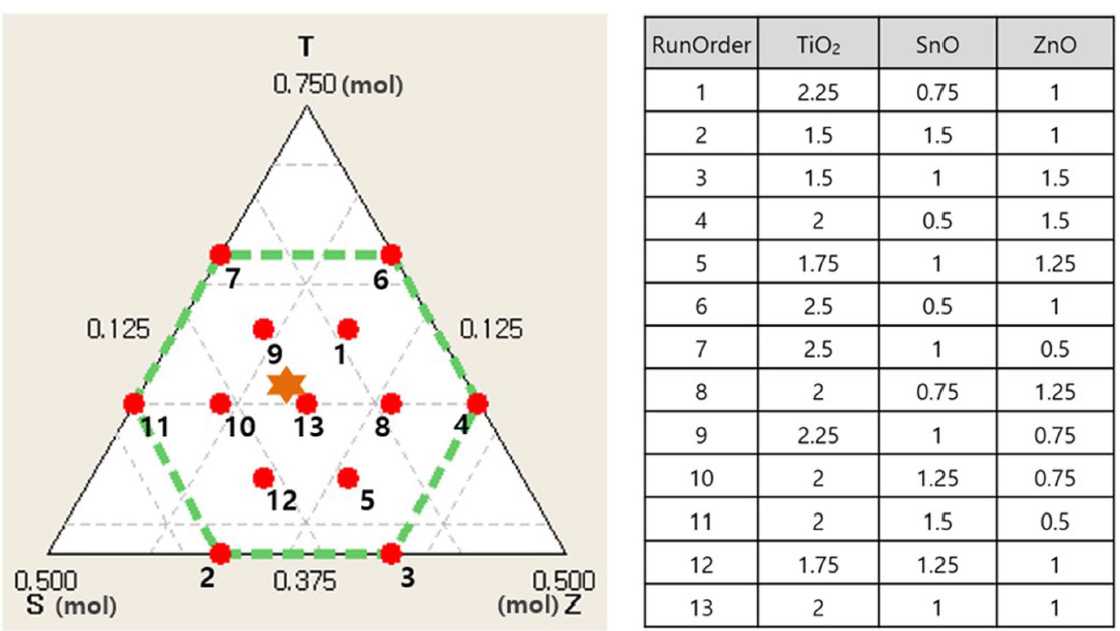
This study analyzes the cause of color formation and change in inorganic pigments depending on the compositional variation of the TiO2-SnO-ZnO system. We conducted mixture design using the statistical program (Minitab) by setting the range of the main components. Fig. 1 shows the drawing of the simplex (linear design with more than two variables) designed by the Design of Experiment. The single total for three components was set to 4 mol, and 13 compositions were designed with upper and lower limits between 2.5 and 1.5 mol, 1.5 and 0.5 mol, and 1.5 and 0.5 mol for TiO2, SnO, and ZnO, respectively.
Titanium oxide (TiO2, 98%, DAEJUNG CHEM), tin oxide (SnO, 97%, JUNSEI), and zinc oxide (ZnO, 98%, DAEJUNG CHEM) were used as starting materials. These materials were mixed with de-ionized water at 1 : 1 ratio in weight at 150 rpm for 24 h using the ball mill. The mixed slurry was dried at 100°C for 24 h, placed in an alumina crucible, and heat treated with the alumina plate at the top. The heat treatment was performed by increasing the temperature up to 900°C at 5°C/min under air atmosphere, supplying the mixed gas (LPG 5 L/min + Air 0.7 L/min) at 900°C for 6 h, and then cooling under reducing atmosphere.
To analyze the chromaticity of 13 synthesized pigments, we measured L*, a*, and b* values in the color coordinates of the Commission International de I’Eclairage using the UV-vis spectrophotometer (JASCO, V-770, Japan). The L* represents the brightness ranging from 0 (black) to 100 (white) while a* and b* are the chromaticity coordinates. Here, a* is denoted as red (+a) and green (−a); and b* is denoted as yellow (+b) and blue (−b).2,3,10) In this study, X-ray diffraction (XRD, D/MAX2500VL/PC, Rigaku, Japan) was used to analyze the crystalline phase of pigments. X-ray photoelectron spectroscopy (XPS, PHI 5000 versaprobe, ULVAC-PHI Inc., Japan) was used to analyze the oxidation state of Ti, Sn, and Zn elements. The pass energy of the hemispherical energy analyzer was set to 23.5 eV for the analysis of photoelectron energy, and the binding energy of each element was measured in the range between 0 and 1200 eV.
3. Results and Discussion
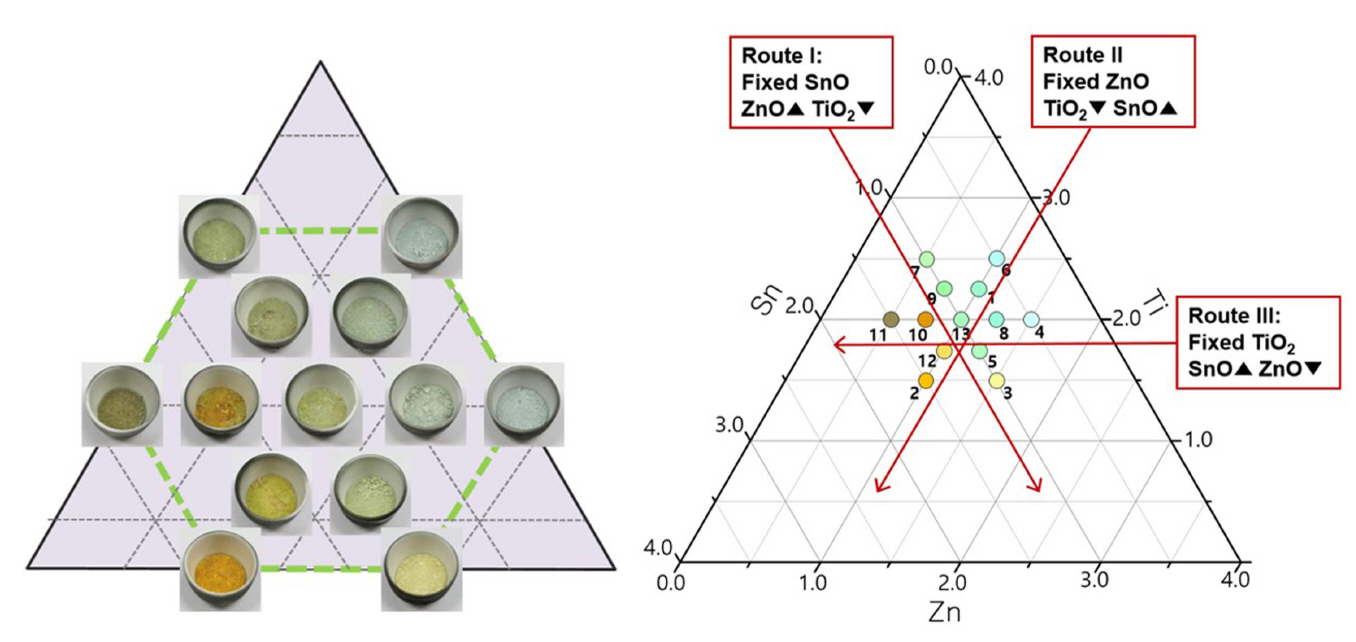
The synthesized pigments were arranged on the ternary diagram, as shown in Fig. 2. Various color changes were observed from orange to yellow, green, and blue. To analyze the color change depending on the main components, one component was fixed while the remaining two components were changed in three routes.
For Route I, the addition of ZnO increased and that of TiO2 decreased with the SnO fixed to 1 mol. Nos. 7, 9, 13, and 5 mainly showed pale green and No. 3 showed yellow, but they did not show large color fluctuations. For Route II, with ZnO fixed to 1 mol, various color changes were observed as TiO2 decreased and SnO increased. The Nos. 6 and 1 compositions which contained high TiO2 showed blue color, but the color changed to green and yellow with the decrease in TiO2 and increase in SnO. Then, the color changed to orange in the No. 2 composition, which contained the highest amount of SnO. For Route III, SnO increased and ZnO decreased with TiO2 fixed to 2 mol. The color changed from blue to green, and from orange to brown in the Nos. 10 and 11 compositions. The above three routes showed large color fluctuations to orange when the amount of SnO increased over 1 mol.
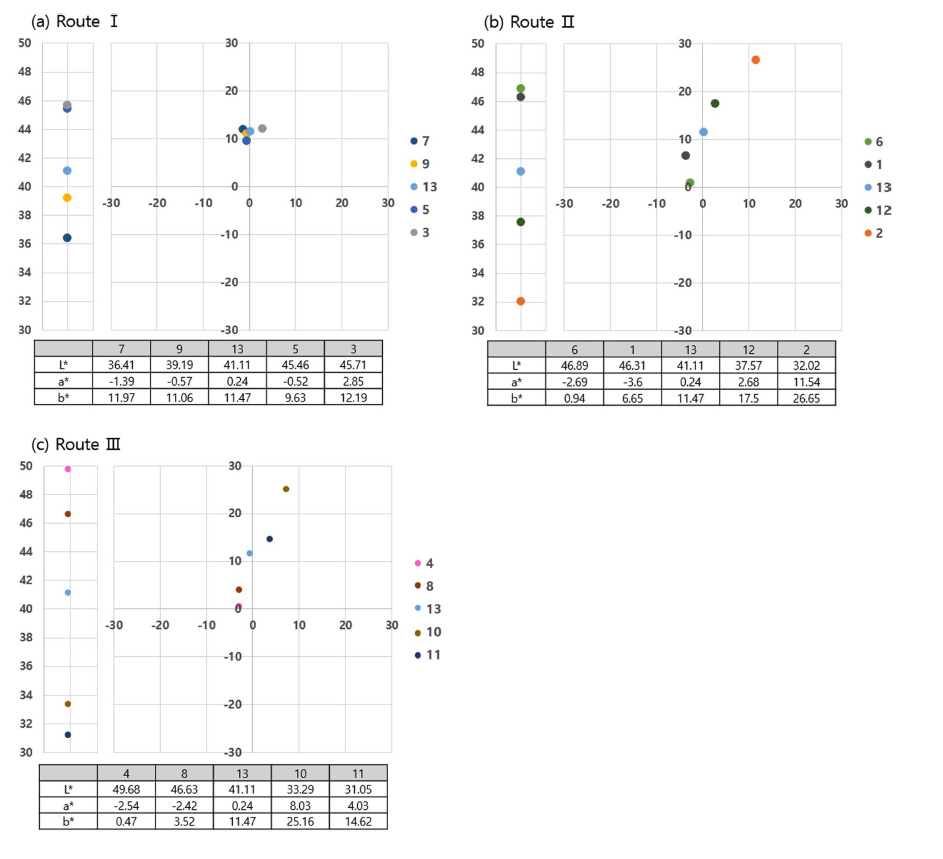
Figure 3 shows the pigment colors measured by the spectrophotometer. L* increased from 36.41 to 45.71 in Route I (Fixed SnO: ZnO up, TiO2 down), which suggests that the ZnO content is the decisive factor affecting the L* value. The a* value is nearly 0, ranging from −1.39 to 2.85, and the b* value ranges from 9.63 to 12.19, showing that its color fluctuation is not large and has only yellow color.
The Route II (Fixed ZnO : TiO2 ▼, SnO ▲) shows various color changes. Nos. 6 and 1 pigments have a* values of −2.69 and −3.6, respectively, and their color is blue. Meanwhile, No. 12 pigment shows gradual decrease in TiO2 and increase in SnO, and has the color yellow with a* value of 2.68 and b* value of 17.5. No. 2 pigment, which contains a high ratio of SnO, has a* and b* values of 11.54 and 26.65, respectively. It was also observed that the orange pigment was synthesized.
In Route III (Fixed TiO2: SnO up, ZnO down), Nos. 4 and 8 have a* values of −2.54 and −2.42, respectively, showing the color blue. No. 10, where the amount of SnO increased to 1.25 mol, shows the color orange with a* value of 8.03 and b* value of 25.16. No. 11 pigment, which contains the highest ratio of SnO of 1.5 mol and lowest ZnO of 0.5 mol, has a* value of 4.03 and b* value of 14.62, showing color changes to brown. The observation of the L* value in Routes II and III shows that the L* value fell sharply from the late 40s to the early 30s with the increase in SnO content.
Figure 4 shows the main effect plot between the composition and the chromaticity analyzed by the statistical program. The larger the graph slope, the greater the effect on the chromaticity. The main effect plot of L* shows large fluctuations in SnO and ZnO, and the effects of two elements are inversely proportional to each other. As the content of SnO increases, the L* value decreases sharply; as the content of ZnO increases, the L* value increases greatly. Meanwhile, TiO2 does not show any significant change in slope, suggesting that TiO2 has little effect on L*.
The main effect plot of a* shows large fluctuations in TiO2 and SnO. As TiO2 increases, the a* value decreases and becomes a negative value, which means that the green color appears with increased TiO2 content. Also, as the content of SnO increases, the a* value shows a positive value, which means that the red color appears with decreased TiO2 and increased SnO contents. It was confirmed that ZnO has less effect on the a* value than other components.
The main effect plot of b* shows that as the content of TiO2 increases, the b* value decreases; as the content of SnO increases, the b* value increases. It may be said that SnO has the greatest effect on the main effect plot of b* because the SnO shows relatively large fluctuation compared with other components in the plot.
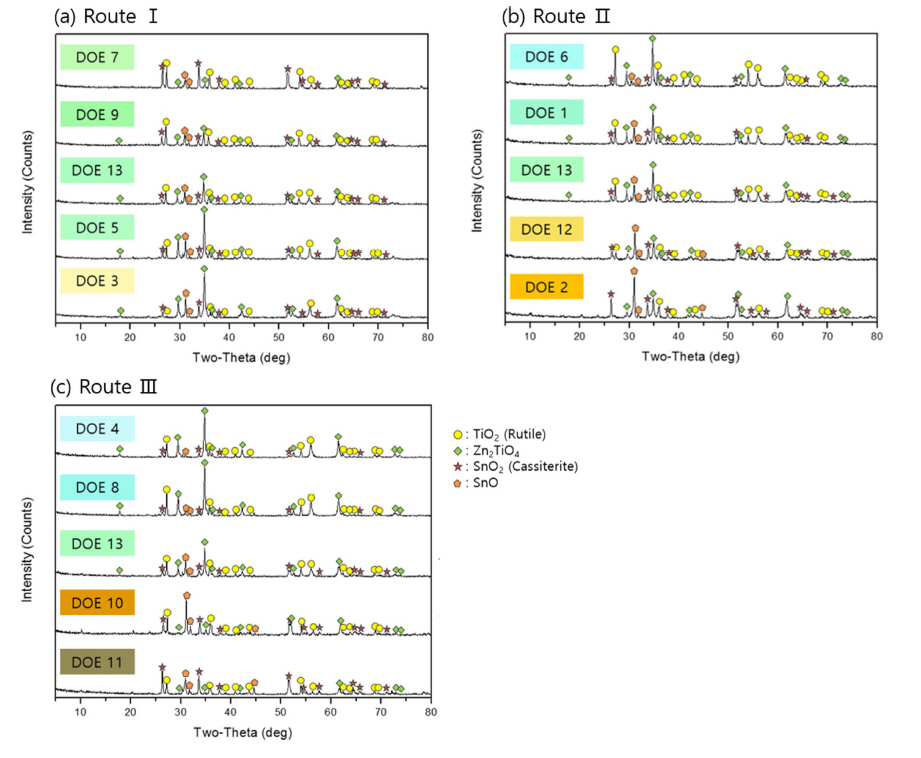
Figure 5 shows the crystalline phase analysis of pigments classified by each route. The results of Route I (Fixed SnO: ZnO up, TiO2 down) showed the existence of TiO2 (Rutile), Zn2TiO4, SnO2 (Cassiterite), and SnO. The result revealed that the peaks of Zn2TiO4, and SnO increased as ZnO increased and TiO2 decreased, and the peak intensity of TiO2 and SnO2 gradually decreased. The main peak gradually changed from TiO2 and SnO2 to Zn2TiO4.
The XRD results in Route II (Fixed ZnO: TiO2 down, SnO up) showed that Zn2TiO4 and TiO2 were the main peaks but their intensity gradually decreased and the intensities of SnO2 and SnO increased. The main peak of Nos. 12 and 2 pigments, which are colors yellow and orange, was SnO.
In Route III (Fixed TiO2: SnO up, ZnO down), the Zn2TiO4 peak decreases but the peak intensities of SnO2 and SnO increased. SnO appears as the main peak as the addition of SnO increases. The No. 11 pigment, which has the main peak at SnO2, shows the color brown. This means that the yellow-orange color appears when the SnO is the main peak as in the second route, and the green-blue appears at the main peak of Zn2TiO4.
The correlation between the color and crystalline phase shows that the main peak of green-blue pigments is Zn2TiO4 (Nos. 1, 4, 5, 6, 8, 9, 13). In particular, the main peak of blue color is mainly TiO2 in addition to Zn2TiO4. The main peak of No.3 pale yellow pigment is Zn2TiO4, and the second peak is SnO. Pigments Nos. 12, 2, and 10 of yellow-orange color have the main peak at SnO.
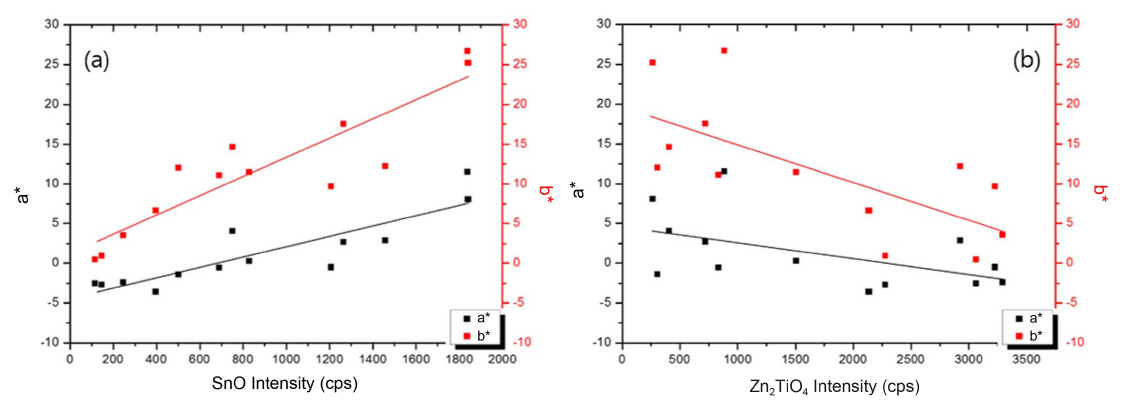
Figure 6 shows the change in a* and b* values depending on the peak intensity of major crystalline phases identified from XRD analysis. Among the four major phases exhibited in the analysis, the (101) peak of SnO related to the yellow-orange color, and the (311) peak of Zn2TiO4 related to the green-blue color were selected for the comparative study.
The correlation between the SnO peak intensity and chromaticity values a* and b* shows that as the intensity increases, a* and b* values increase. The pigment Nos. 2 and 12, which exhibited color values of orange, have SnO intensity of more than 1800. Meanwhile, the relation between the Zn2TiO4 peak intensity and chromaticity shows that a* and b* values tend to decrease as the Zn2TiO4 peak intensity increases. In both cases, the change in a* is relatively small. The main crystalline phase depends on the contents of each element and this affects color trends.
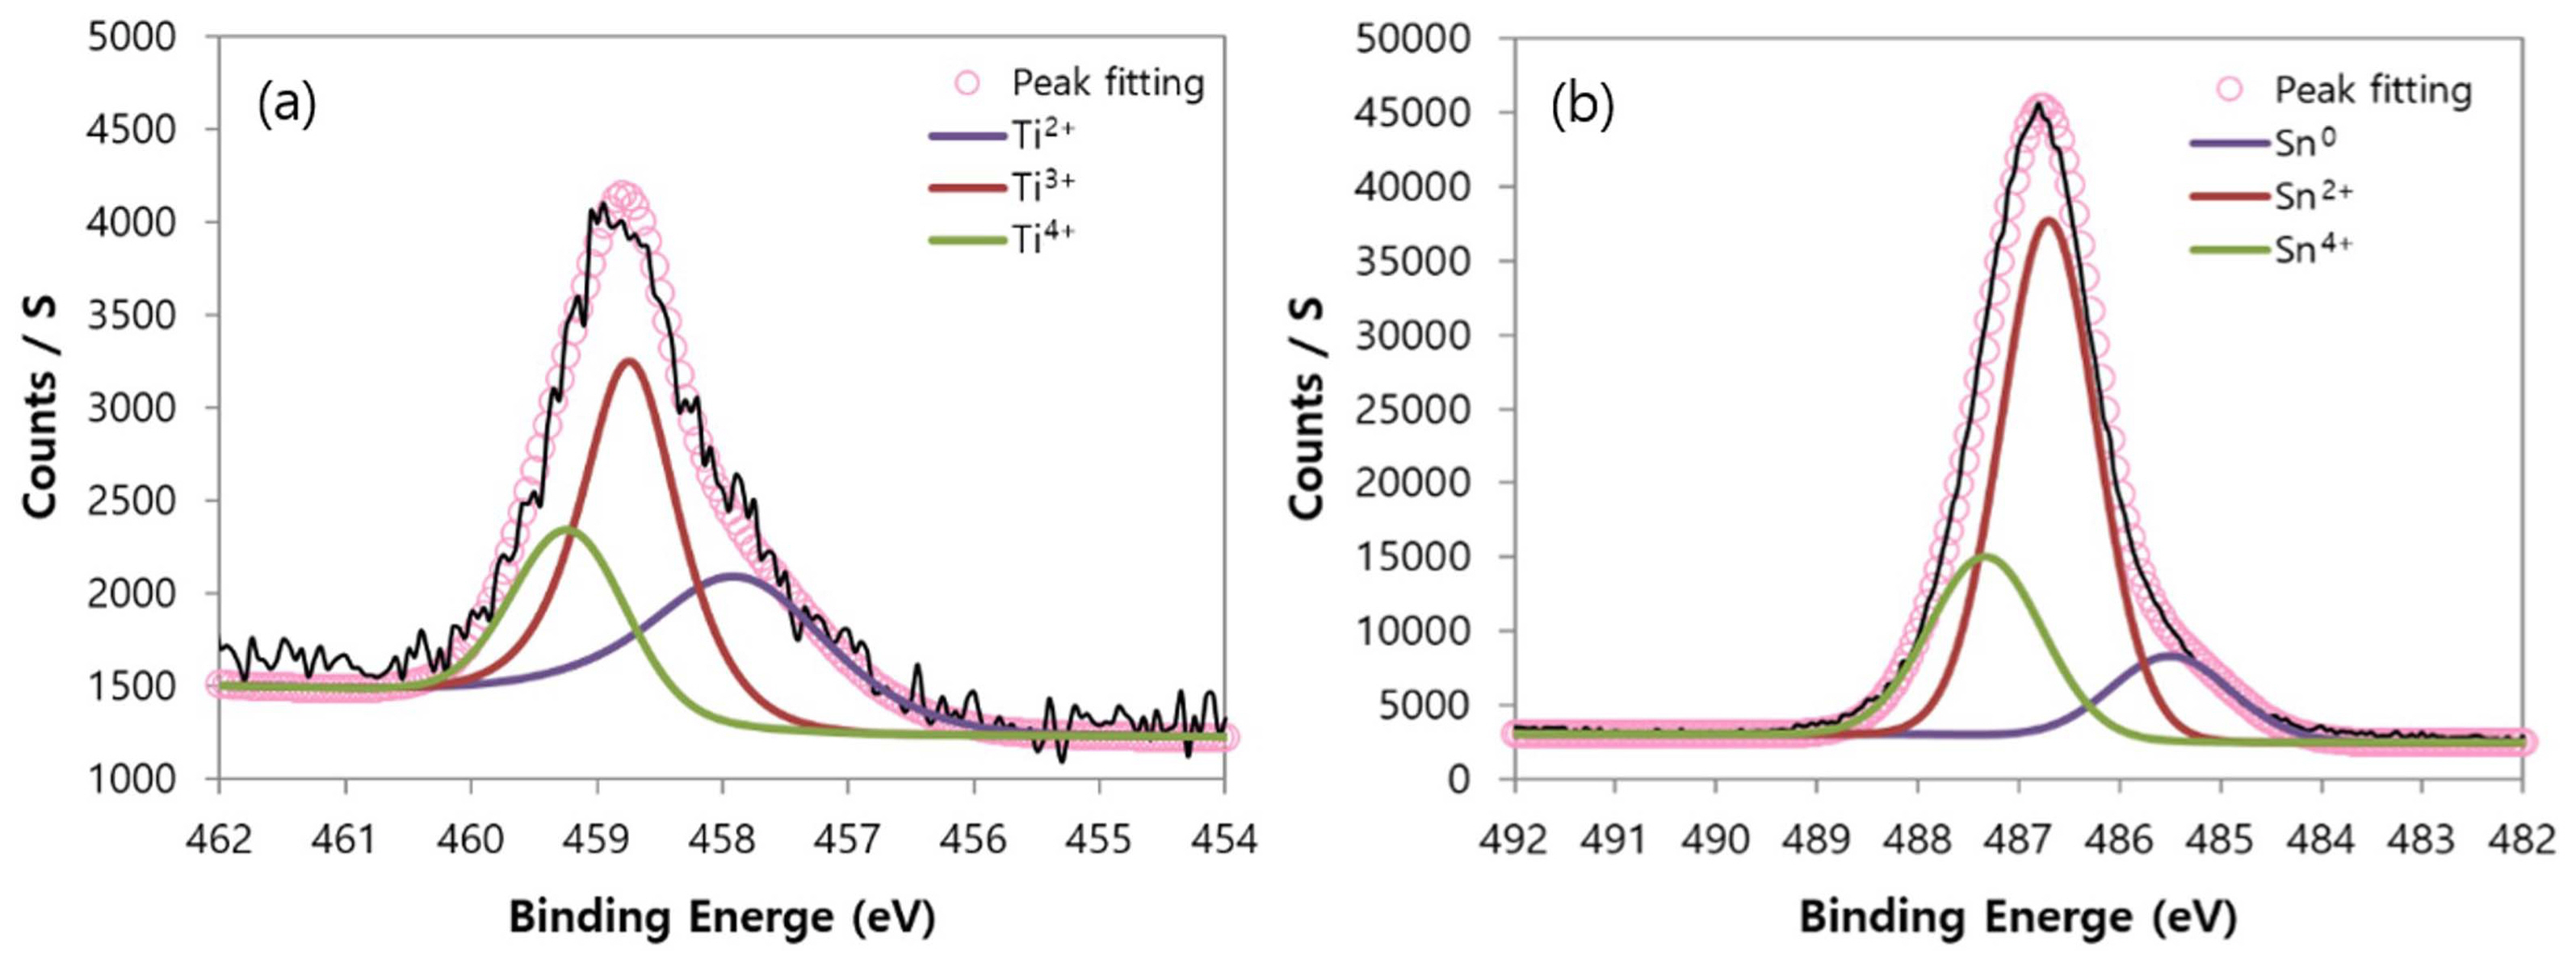
We analyzed the oxidation state of elements forming 13 pigments through XPS measurement. Fig. 7 shows the XPS analysis result for Ti, Sn, and Zn elements that existed in pigment No. 1 as an example. We performed the peak fitting for each element using the Shirley method. The peak fitting for each element was calibrated at the carbon peak of C1s 284.6 eV. Each peak was analyzed at 458.8 eV for Ti2P3/2, 486.8 eV for Sn3d5/2, and 1022.2 eV for Zn2p3/2 referring to existing XPS analysis literature.11-13)
The core level spectrum area of Ti, Sn, and Zn elements was calculated using the Avantage v.4.12 for the quantitative analysis of the oxidation state. Fig. 8 shows the fitting result of pigment No. 1 as an example. Ti was found to exist as three different states of divalence, trivalence, and tetravalence in the range 458.8 ± 0.4 eV by analyzing Ti2P3/2. The analysis on the Sn3d5/2 shows that Sn element has a metal state of Sn (Sn0) in the range 485.6 ± 0.4 eV, and has divalence and tetravalence states of Sn in the range 486.7 ± 0.4 eV and 487.22 ± 0.4 eV, respectively. Zn was excluded from the analysis because it only exists as a stable divalence state unlike Ti and Sn.
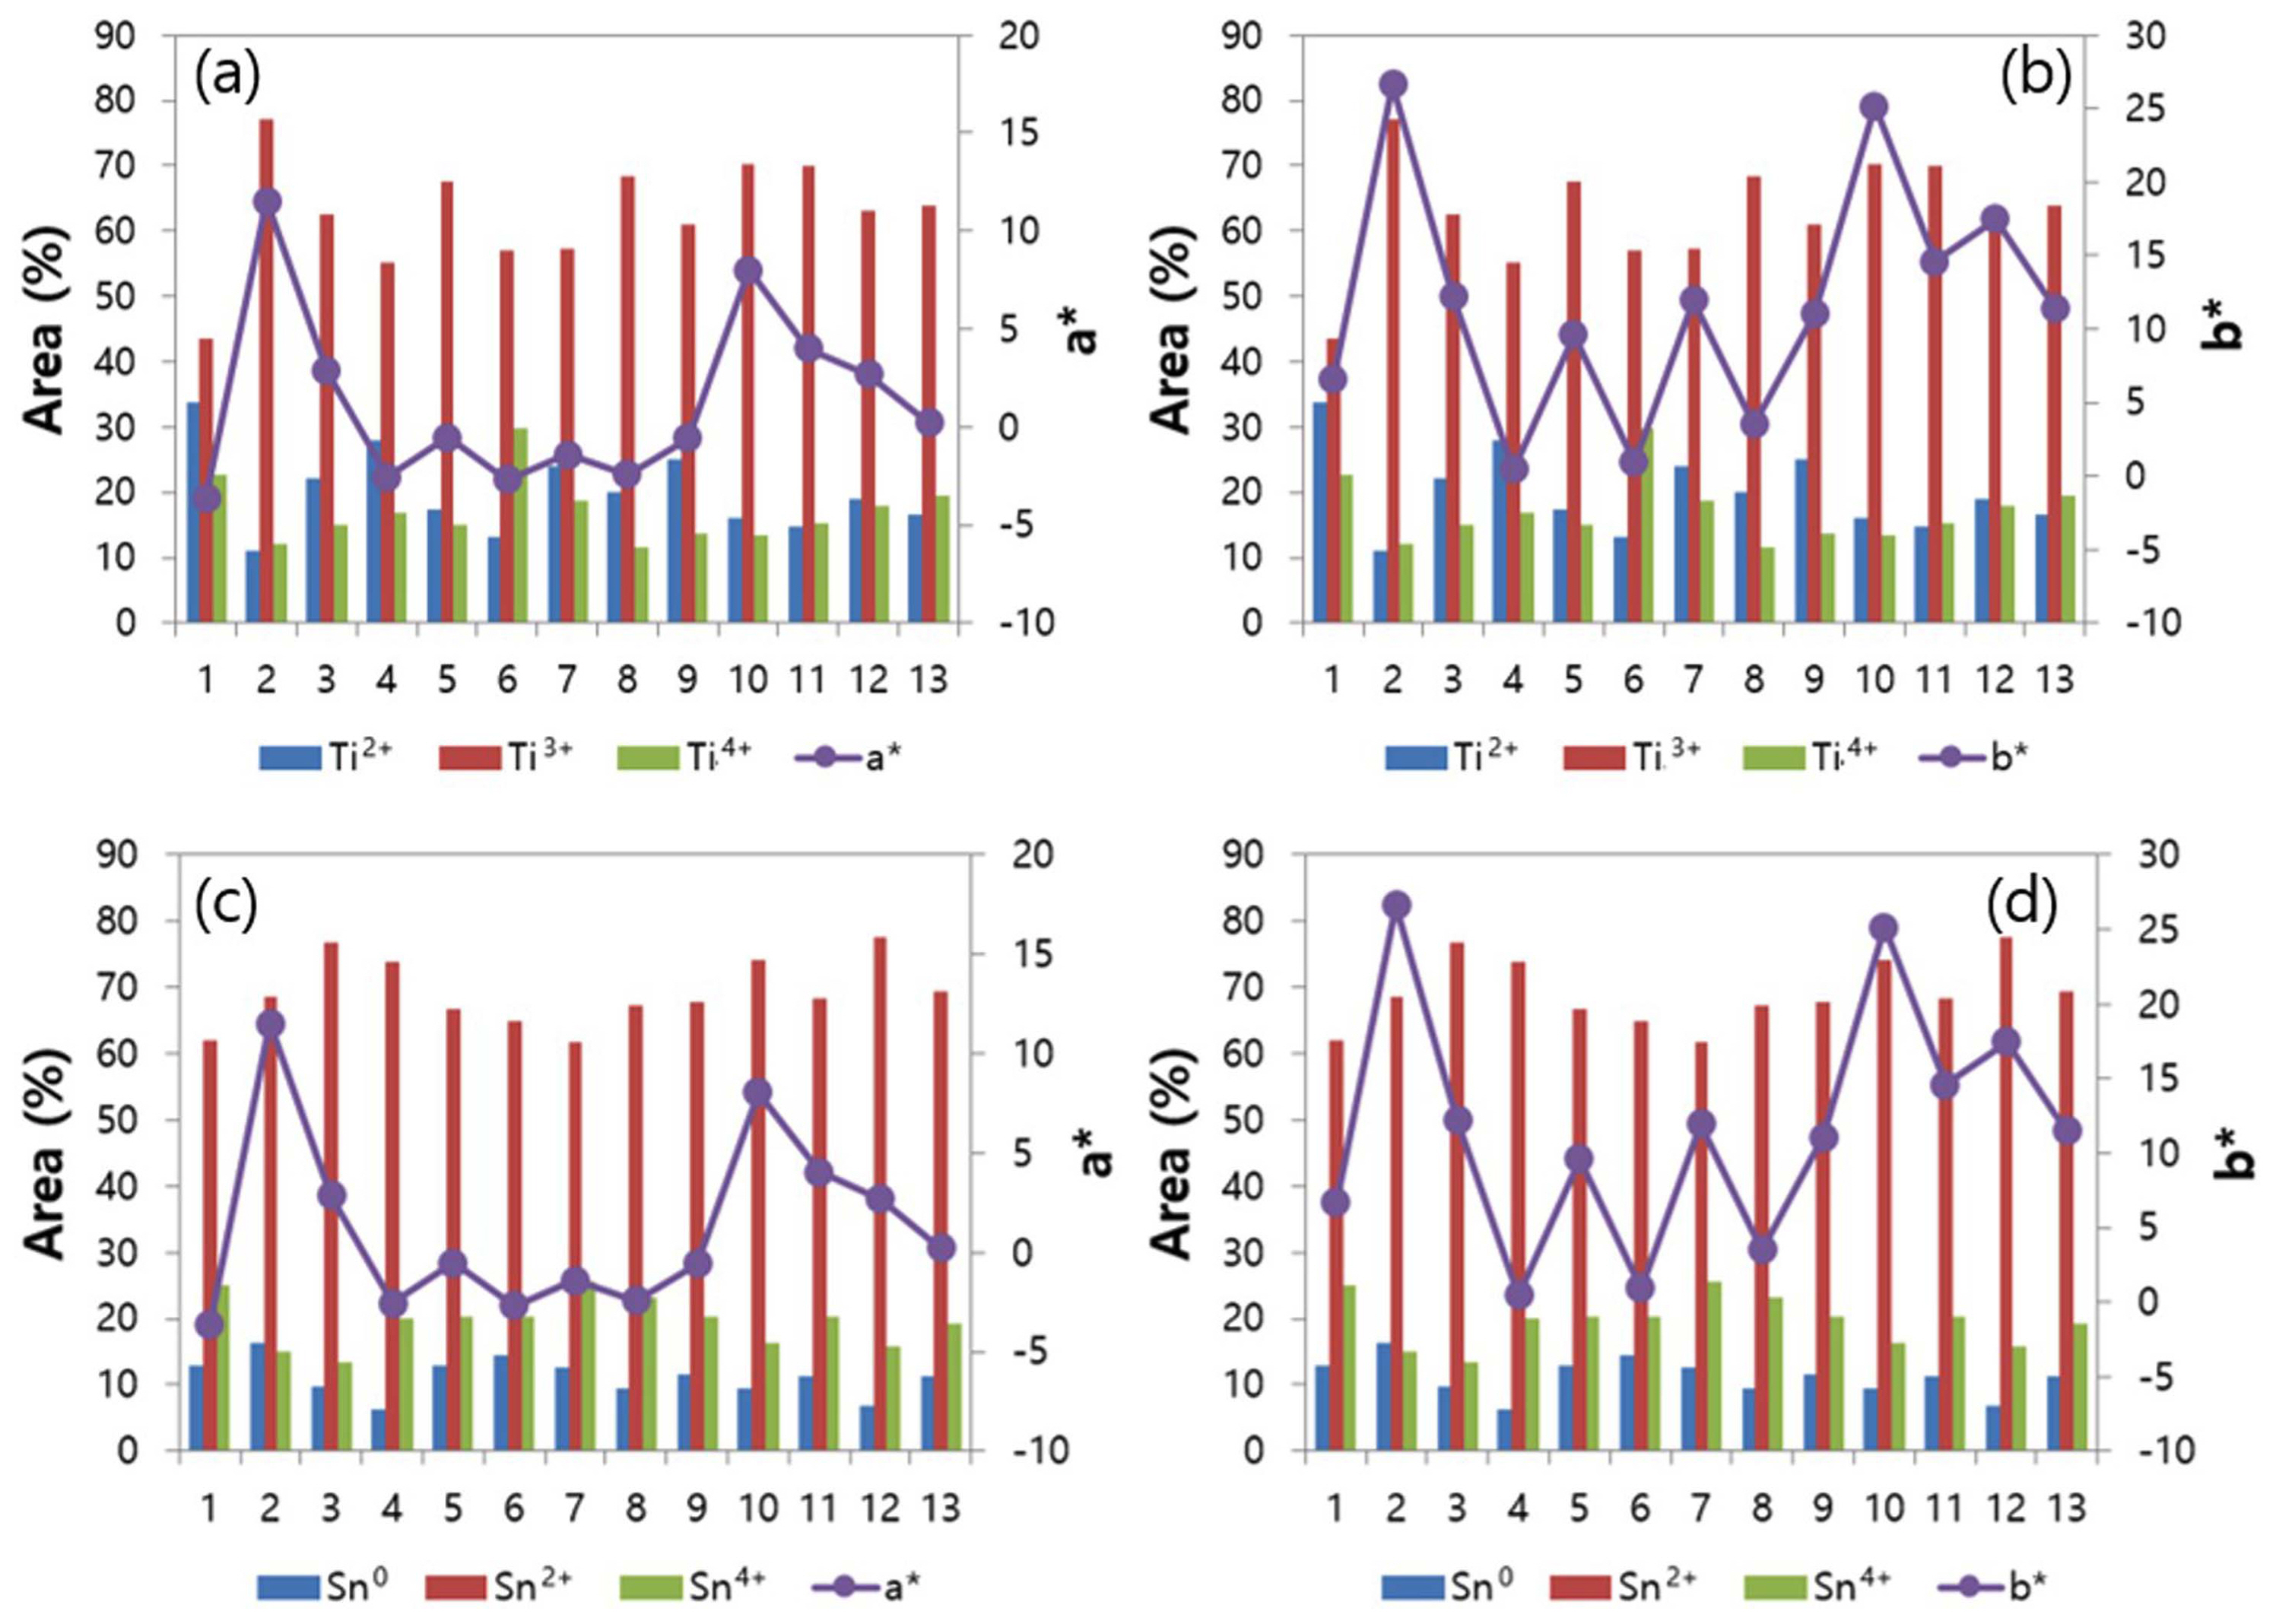
Figure 9 shows how the oxidation state of each element affects the chromaticity (a*, b*). Fig. 9(a) shows that the change in a* and b* is similar to that of Ti3+ portion. As the ratio of Ti3+ increases, a* and b* values increase in the positive direction (a*: red, b*: yellow) as a whole; as the ratio of Ti3+ decreases, the values decrease in the negative direction. Fig. 9(b) shows that a* and b* have weak correlation with the oxidation state of Sn. The XPS analysis result indicates that the crystalline phases formed by raw materials and each portion significantly affect the pigment color formation rather than the oxidation state of the element.
4. Conclusions
In this study, color development in the TiO2-SnO-ZnO system was investigated using the Design of Experiment. Thirteen compositions were designed for TiO2, SnO, and ZnO, respectively, and the pigments were synthesized using solid-state reaction. The chromaticity of 13 synthesized pigments exhibited various pastel colors depending on the change in compositions ranging from yellow, orange, and green, blue to brown. It was confirmed that various colors were formed depending on the change in composition.
The analysis of the chromaticity using the statistical program shows that L* decreases as the content of SnO increases, but L* increases as the content of ZnO increases. It also shows that a* and b* decrease as the content of TiO2 increases, but increase as the content of SnO increases.
These results can be analyzed in relation to the crystalline phase analysis. The compositions which show the main peak at Zn2TiO4 exhibited color values of green-blue. Meanwhile, the compositions which show the main peak at SnO exhibited a color value of yellow-orange, and the compositions which show the main peak at SnO2 (Cassiterite) exhibited a color value of brown. The analysis of the correlation between the intensities and chromaticity of these main peaks indicates that a* and b* increase as the intensity of SnO increases, but decrease as the intensity of Zn2TiO4 increases. The results of these experiments provide basic evidence of the main crystalline phase influencing color trends.
The correlation of the chromaticity with the oxidation state of elements was analyzed using XPS. In general, the change in a* and b* values was similar to that of Ti3+ portion. However, no special correlation existed between the chromaticity and oxidation state of Sn. It was confirmed that the color formation of ceramic pigments in the TiO2-SnO-ZnO composition system was strongly influenced by the main crystalline phases rather than the element oxidation state of elements.